Knowledge hub

Six Sigma & Quality

Understand variation and strengthen process quality with DMAIC, SPC, capability, MSA, Pareto analysis, FMEA and prevention-based thinking.

DMAICSPCCapabilityFMEAQuality

Guides in this hub.

Start with the fundamentals, then follow the related methods as the knowledge base grows.

Six Sigma & Quality

Acceptance Sampling: Make Lot Decisions from a Defined Sample Plan

Learn how Acceptance Sampling uses a defined sample plan and acceptance criteria to make lot decisions while recognizing producer and consumer risk.

Acceptance SamplingQualityInspectionSampling
Read guide →
Six Sigma & Quality

Attribute Agreement Analysis: Verify Pass-Fail Consistency

Learn how Attribute Agreement Analysis evaluates repeatability, reproducibility, and agreement with a reference when inspections rely on categorical judgments.

Attribute Agreement AnalysisMeasurement System AnalysisQualityInspection
Read guide →
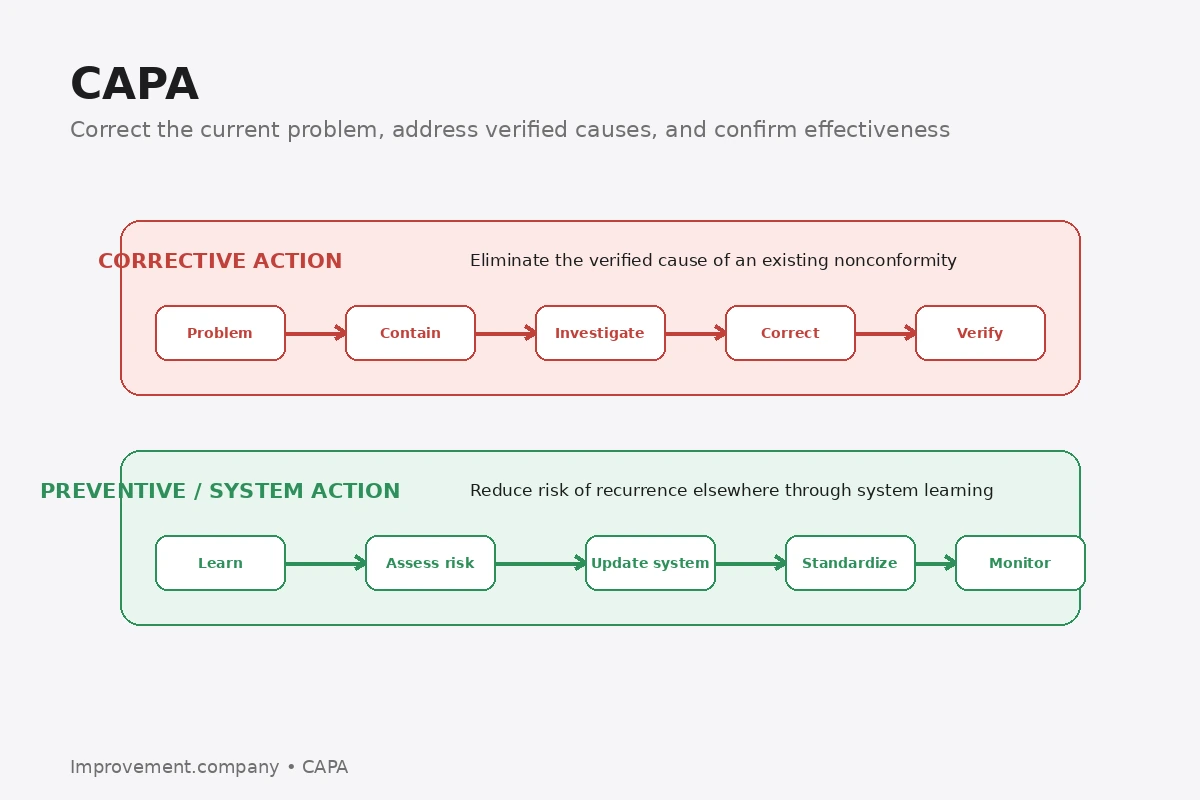
CAPA diagram distinguishing corrective action for an existing nonconformity from broader preventive system learning and effectiveness monitoring.
Six Sigma & Quality

CAPA: Corrective and Preventive Action Explained

Learn how CAPA identifies causes, implements corrective action, reduces recurrence, and strengthens preventive controls.

CAPACorrective ActionPreventive ActionQuality
Read guide →
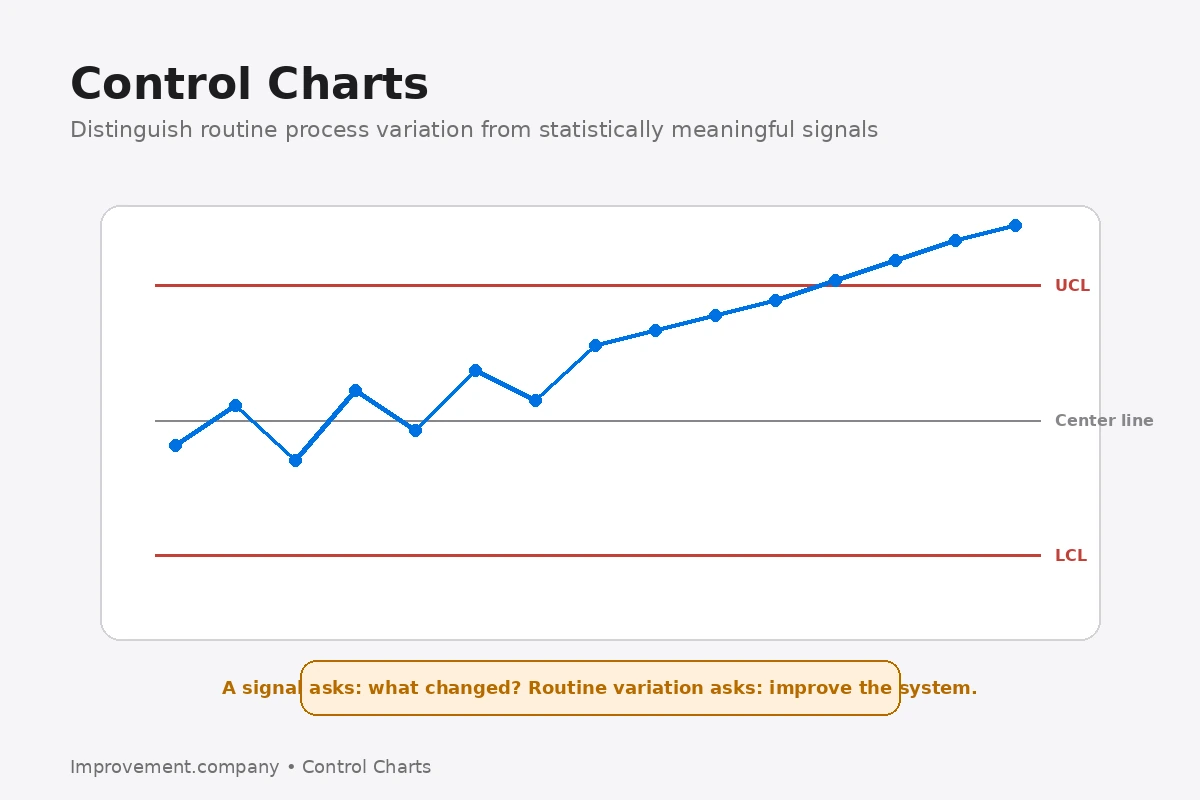
Control chart diagram showing process data against upper and lower control limits with an emerging trend that should trigger investigation.
Six Sigma & Quality

Control Charts: Separate Common and Special Cause Variation

Learn how control charts distinguish routine process variation from signals of meaningful change so teams respond to evidence instead of noise.

SPCVariationControl Charts
Read guide →
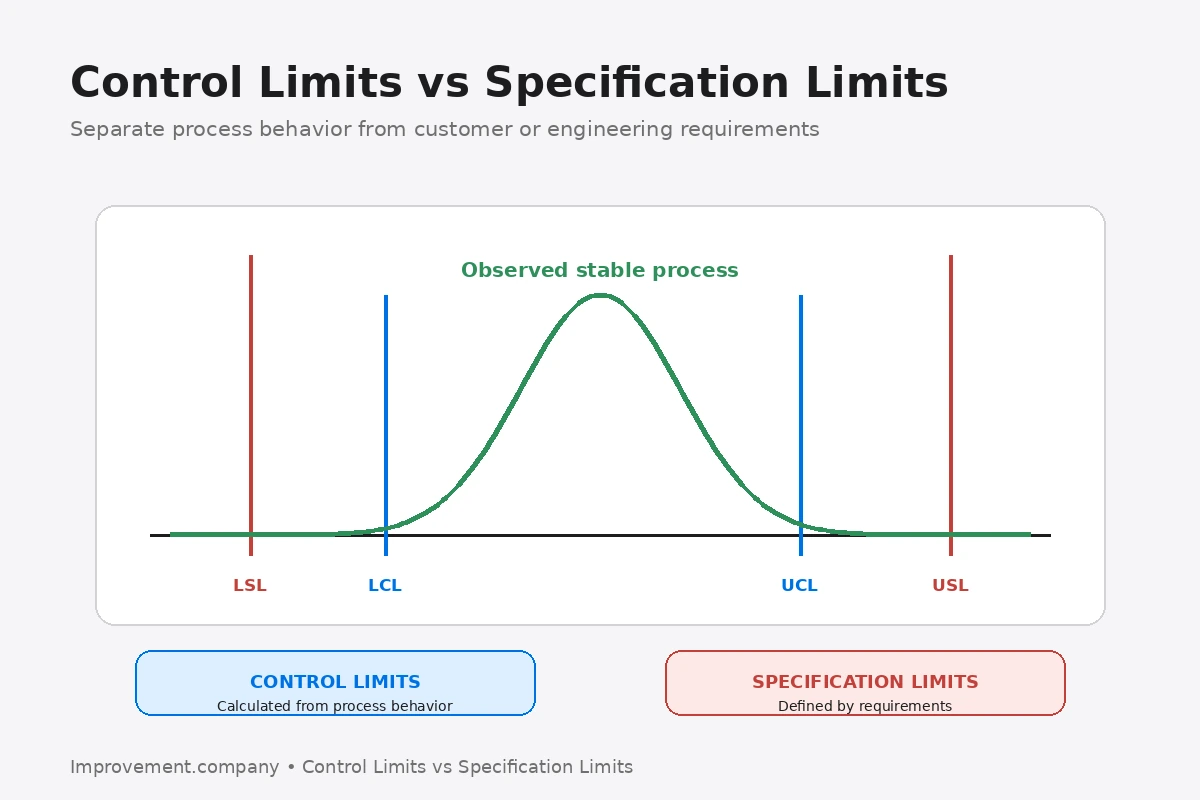
Diagram showing statistically calculated control limits inside separate specification limits, emphasizing that process behavior and requirements are different concepts.
Six Sigma & Quality

Control Limits vs Specification Limits: Know the Difference

Learn the difference between control limits and specification limits, why they come from different sources, and what each tells you about process performance.

Control LimitsSpecification LimitsSPCProcess Capability
Read guide →
Six Sigma & Quality

Control of Nonconforming Output: Prevent Unintended Use or Delivery

Learn how to identify, contain, segregate, disposition, document, and verify nonconforming output so suspect product or service is not used or delivered unintentionally.

Nonconforming OutputQualityContainmentDisposition
Read guide →
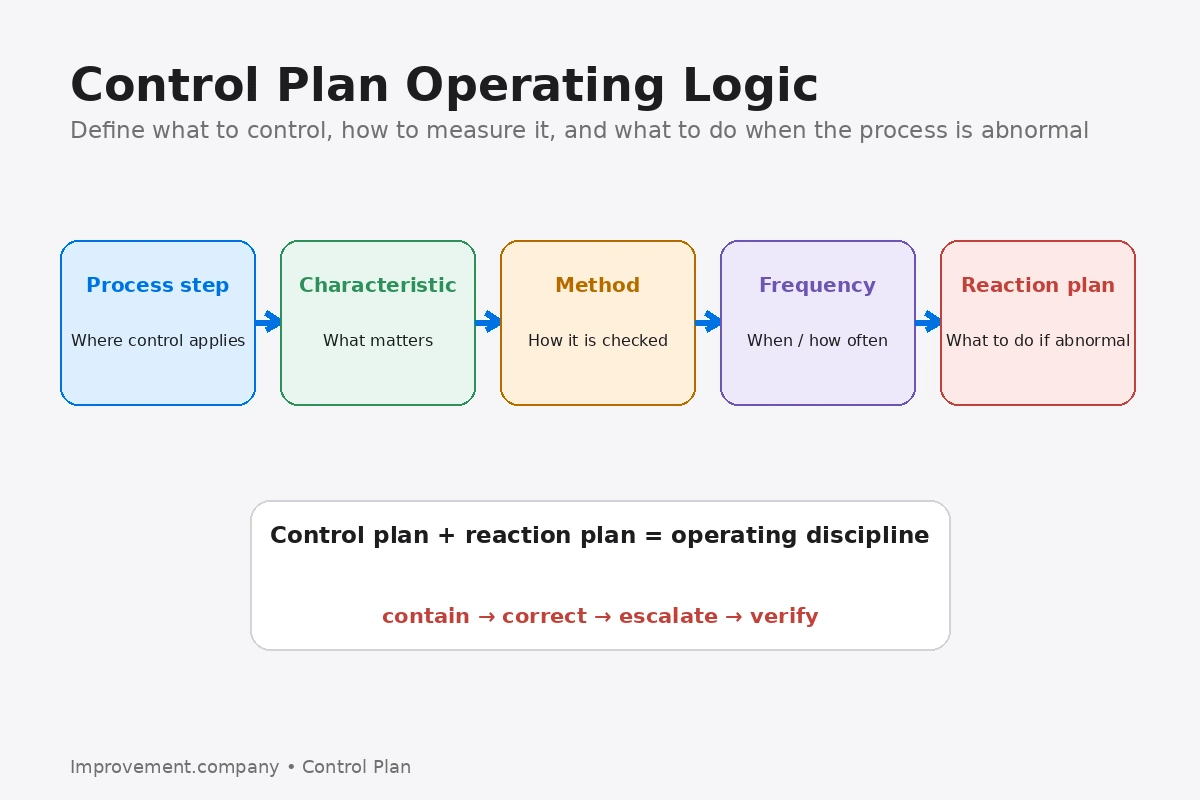
Control Plan logic linking process step, characteristic, control method, frequency, and reaction plan.
Six Sigma & Quality

Control Plan: How to Keep a Process Performing as Intended

Learn how a Control Plan defines what to monitor, how to react, and how to sustain process performance after improvements are implemented.

Control PlanQualityProcess ControlSix Sigma
Read guide →
Six Sigma & Quality

Control Plan Reaction Verification: Does the Reaction Work?

Learn how Control Plan Reaction Verification checks whether abnormal conditions trigger the correct containment, escalation, decision, documentation, and restart actions.

Control Plan Reaction VerificationSix SigmaQualityControl Plan
Read guide →
Six Sigma & Quality

Cost of Poor Quality: Make Quality Loss Visible

Understand Cost of Poor Quality and how prevention, appraisal, internal failure, and external failure costs reveal the financial impact of weak quality systems.

Cost of Poor QualityCOPQQualityWaste
Read guide →
Six Sigma & Quality

Critical to Quality: Translate Customer Needs Into Measures

Learn how CTQs convert customer needs into specific, measurable requirements that can guide process design, quality control, and improvement.

Critical to QualityCTQVoice of CustomerQuality Requirements
Read guide →
Six Sigma & Quality

Data Collection Plan: Define the Evidence Before Collecting Data

Learn how a Data Collection Plan defines what to measure, how to measure it, where, when, by whom, and at what sample size so analysis starts with reliable evidence.

Data Collection PlanSix SigmaMeasurementDMAIC
Read guide →
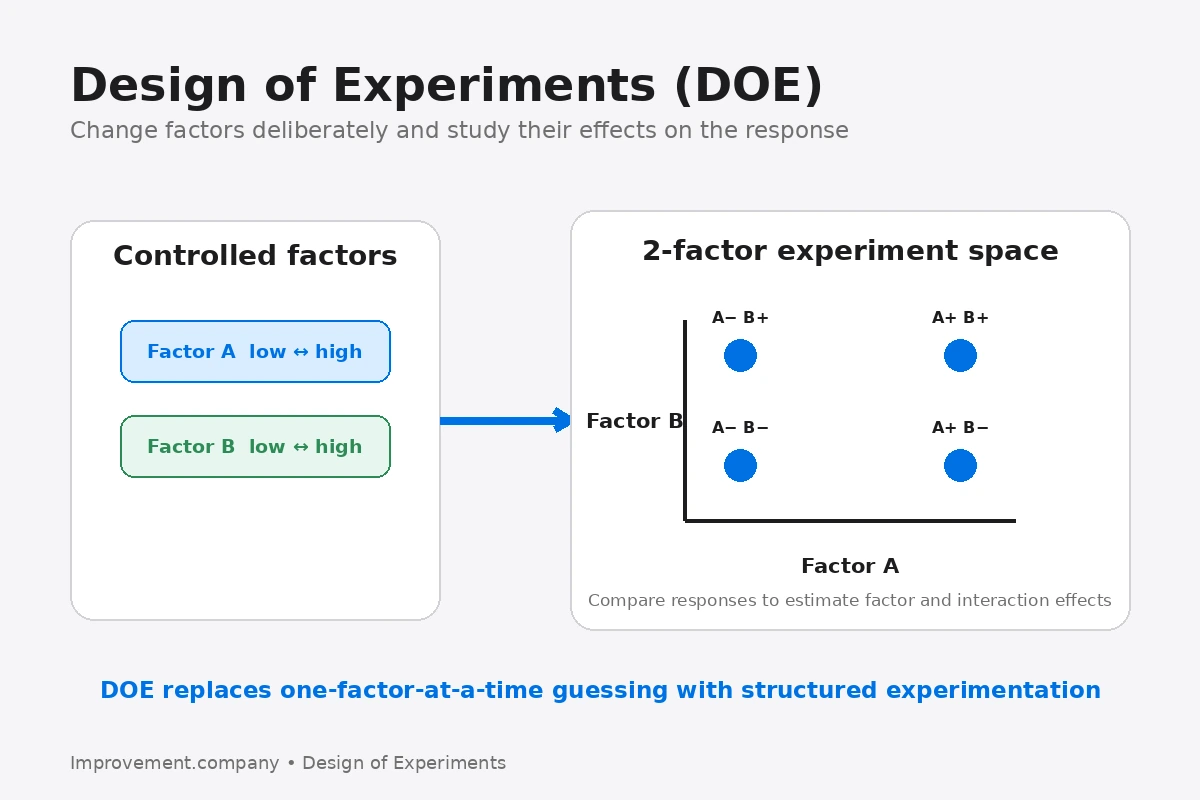
Design of Experiments diagram showing two controlled factors at low and high levels in a two-factor experiment space
Six Sigma & Quality

Design of Experiments (DOE): Learn Which Factors Drive the Result

Learn how Design of Experiments changes multiple factors systematically to identify important effects, interactions, and robust process settings.

Design of ExperimentsDOESix SigmaProcess Optimization
Read guide →
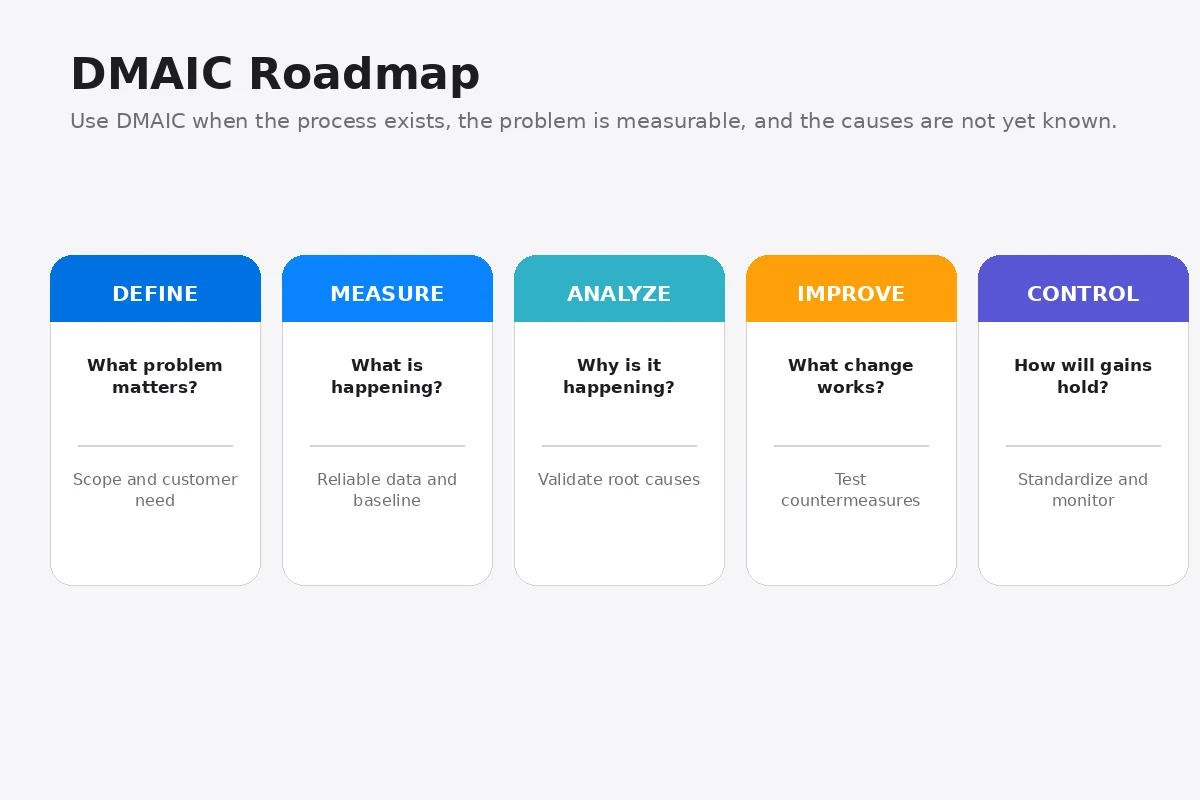
DMAIC roadmap showing Define, Measure, Analyze, Improve, and Control
Six Sigma & Quality

DMAIC

DMAIC is a structured improvement method used to define problems, measure current performance, analyze causes, improve the process and control the gains.

DMAICSix SigmaProcess Improvement
Read guide →
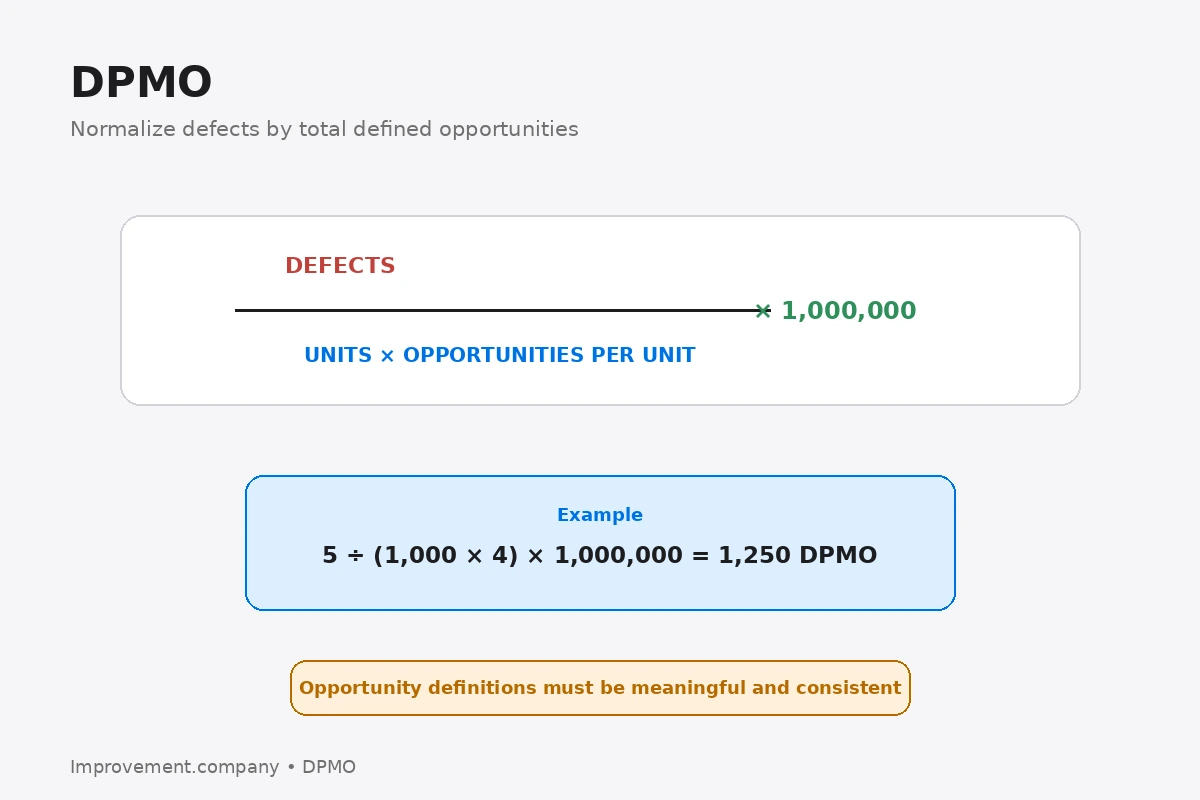
DPMO diagram showing defects divided by units times opportunities per unit, multiplied by one million, with a worked example.
Six Sigma & Quality

DPMO: Measure Defects per Million Opportunities

Learn how DPMO normalizes defects by the number of defect opportunities so processes with different complexity or volume can be compared more meaningfully.

DPMOSix SigmaDefectsQuality
Read guide →
Six Sigma & Quality

First Article Inspection: Verify the Process Before Full Release

Learn how First Article Inspection verifies that an initial production output conforms to defined requirements before normal production continues.

First Article InspectionQualityInspectionProcess Validation
Read guide →
Six Sigma & Quality

First Pass Yield (FPY): Measure Quality Without Rework Hiding the Loss

Learn how First Pass Yield measures how much work passes a process correctly the first time without rework, repair, or repetition.

First Pass YieldFPYQualityRework
Read guide →
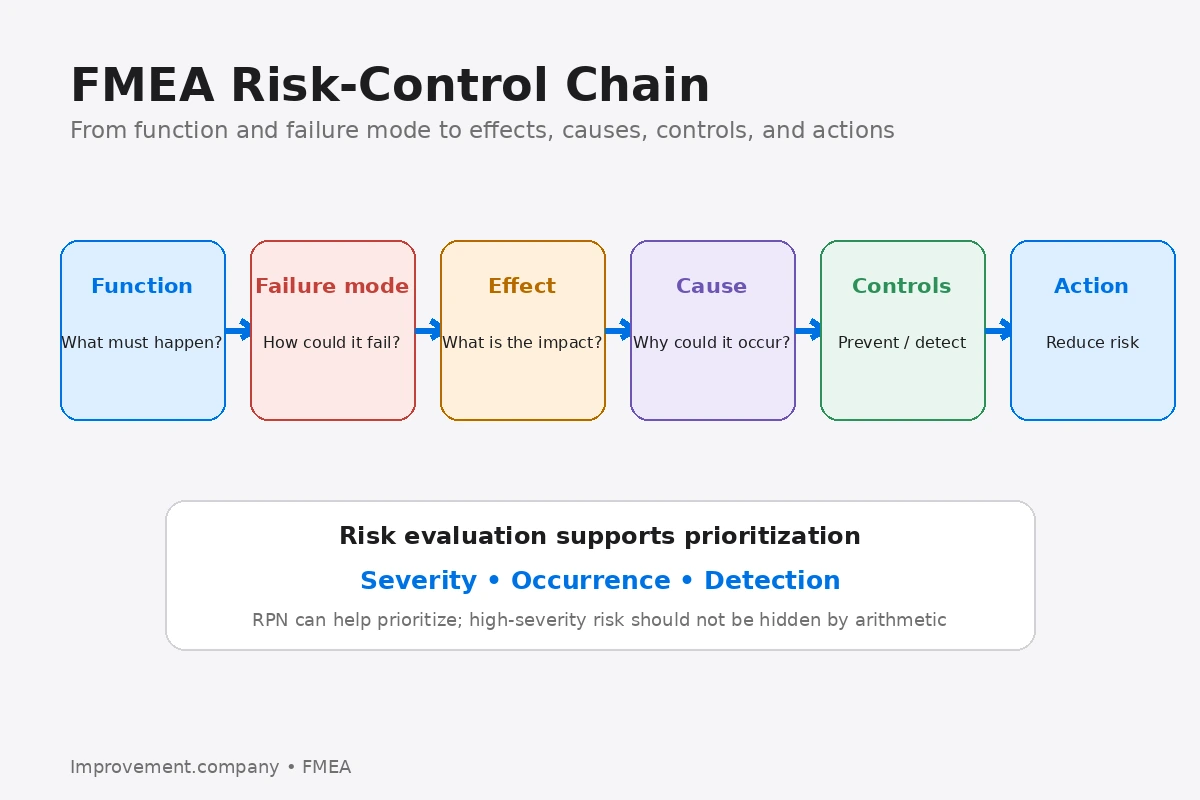
FMEA flow from function through failure mode, effect, cause, controls, and risk-reduction action.
Six Sigma & Quality

Failure Mode and Effects Analysis (FMEA)

FMEA is a structured risk-analysis method used to anticipate how a product or process could fail, understand the effects and strengthen prevention.

FMEARiskPrevention
Read guide →
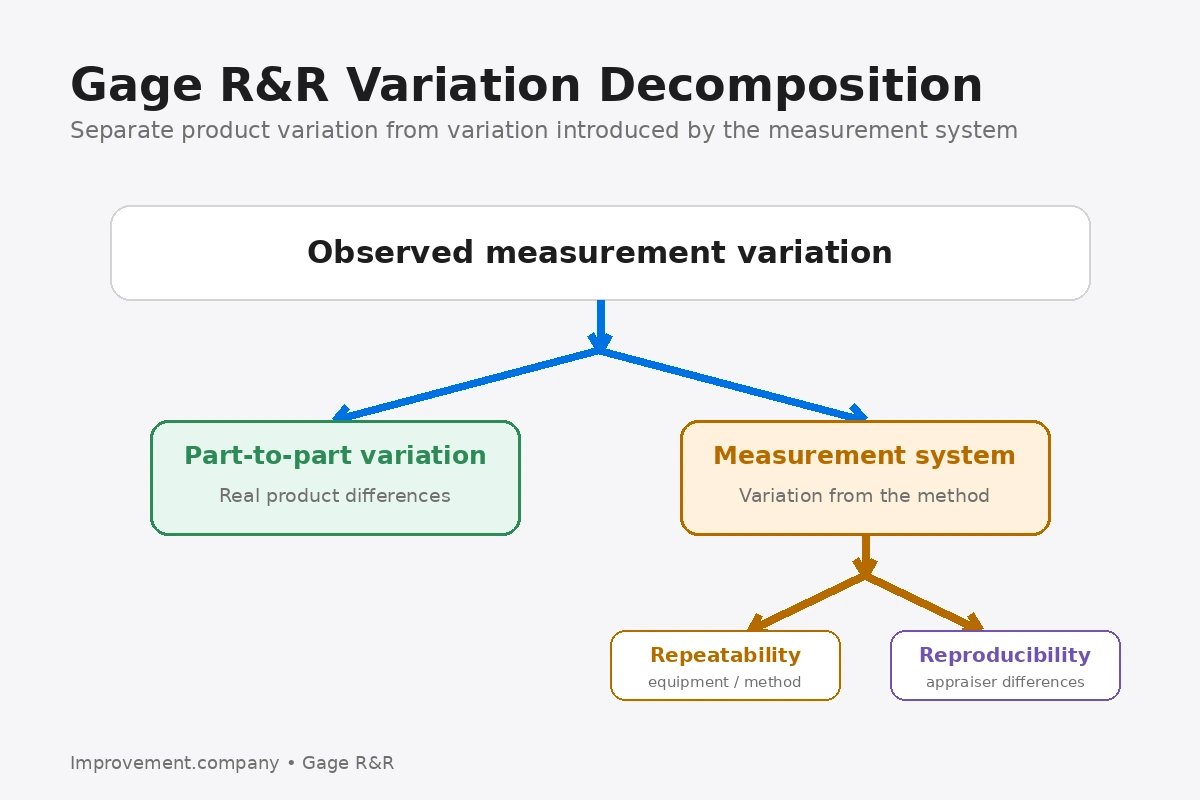
Gage R&R variation diagram separating part-to-part variation from measurement variation, repeatability, and reproducibility
Six Sigma & Quality

Gage R&R: Separate Measurement Variation from Process Variation

Learn how Gage Repeatability and Reproducibility evaluates whether a measurement system is consistent enough for process decisions.

Gage R&RMeasurement System AnalysisRepeatabilityReproducibility
Read guide →
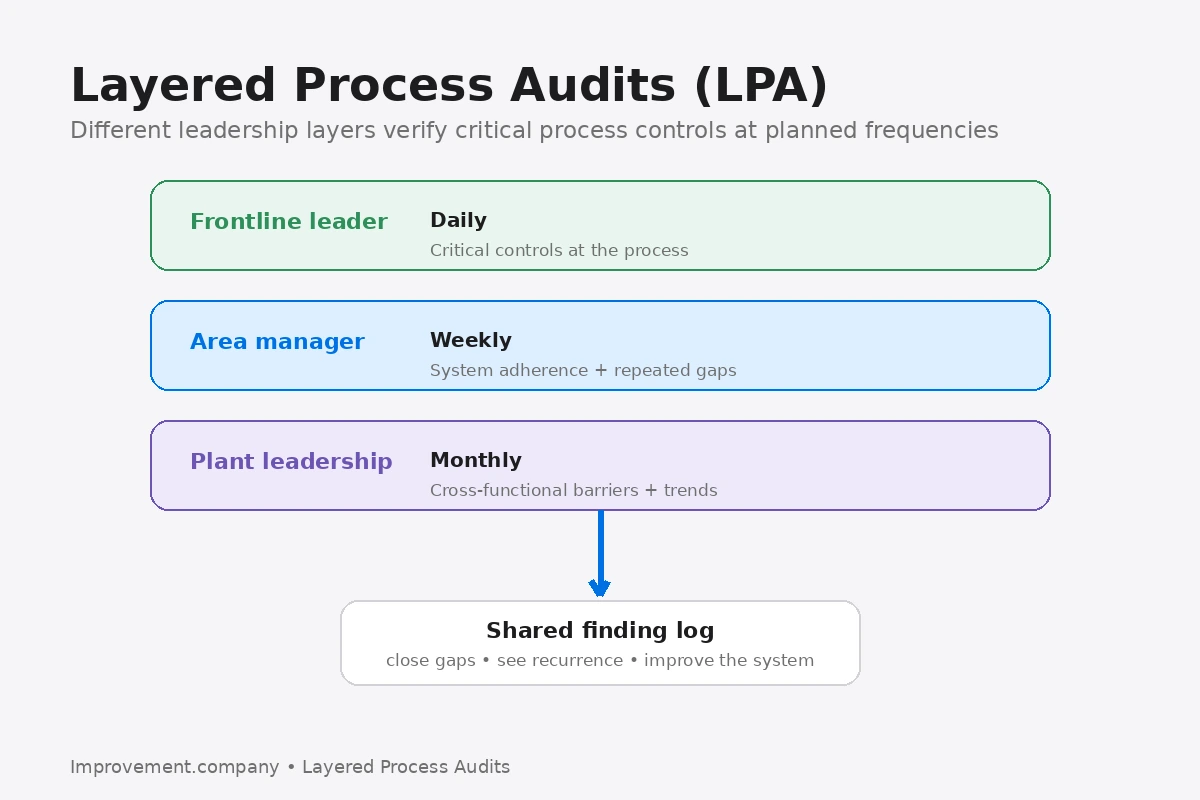
Layered Process Audit cadence showing daily frontline, weekly management, and monthly leadership verification.
Six Sigma & Quality

Layered Process Audits: Verify Critical Controls

Learn how Layered Process Audits use short, repeated checks by multiple leadership levels to verify that critical process controls are working.

Layered Process AuditsLPAQualityProcess Control
Read guide →
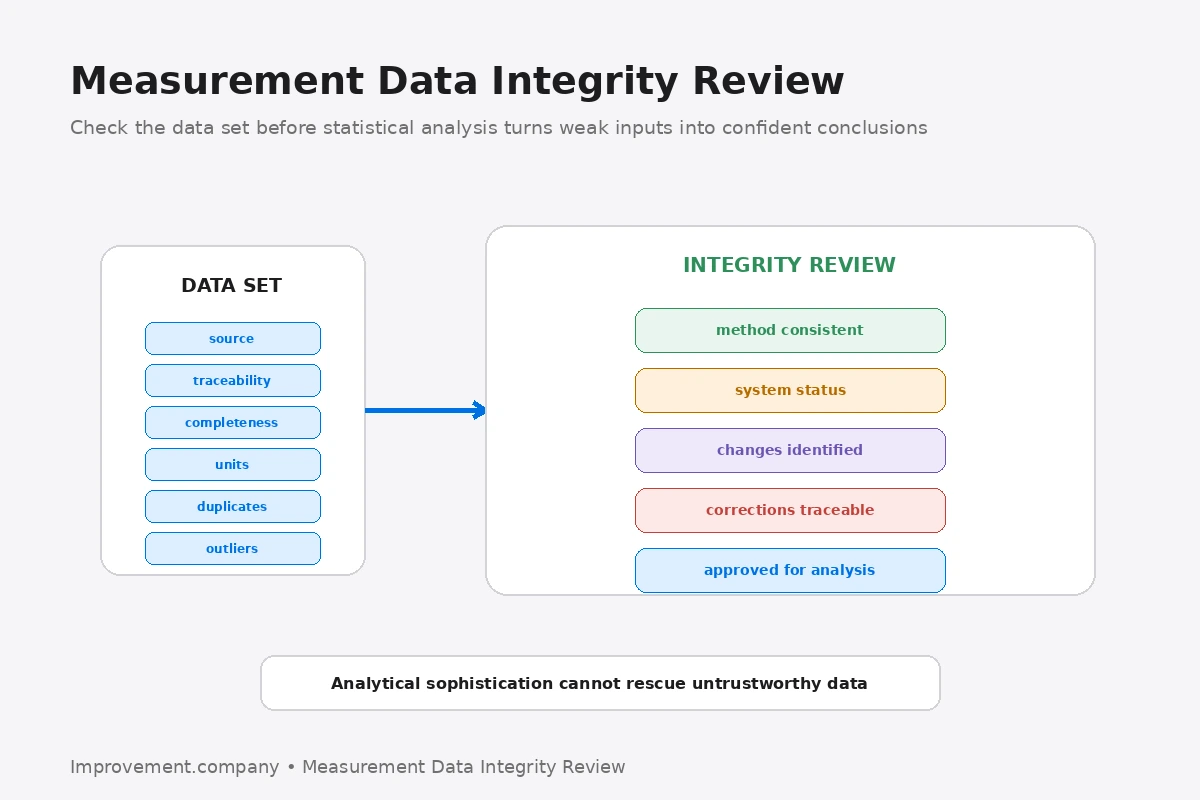
Measurement Data Integrity Review diagram showing source, traceability, completeness, units, duplicates, outliers, method consistency, system status, documented changes, and approval for analysis.
Six Sigma & Quality

Measurement Data Integrity Review: Check Data Before Decisions

Learn how a Measurement Data Integrity Review checks traceability, completeness, units, method consistency, missing values, system changes, and abnormal data before analysis.

Measurement Data Integrity ReviewSix SigmaQualityData Integrity
Read guide →
Six Sigma & Quality

Measurement System Analysis: Can You Trust the Data?

Learn how Measurement System Analysis evaluates measurement variation, including repeatability, reproducibility, bias, stability, and resolution.

Measurement System AnalysisMSAGage R&RQuality
Read guide →
Six Sigma & Quality

Measurement System Change Control: Protect Data Through Change

Learn how Measurement System Change Control evaluates changes to gages, fixtures, methods, software, operators, environment, and specifications before trusting results.

Measurement System Change ControlSix SigmaQualityMeasurement System
Read guide →
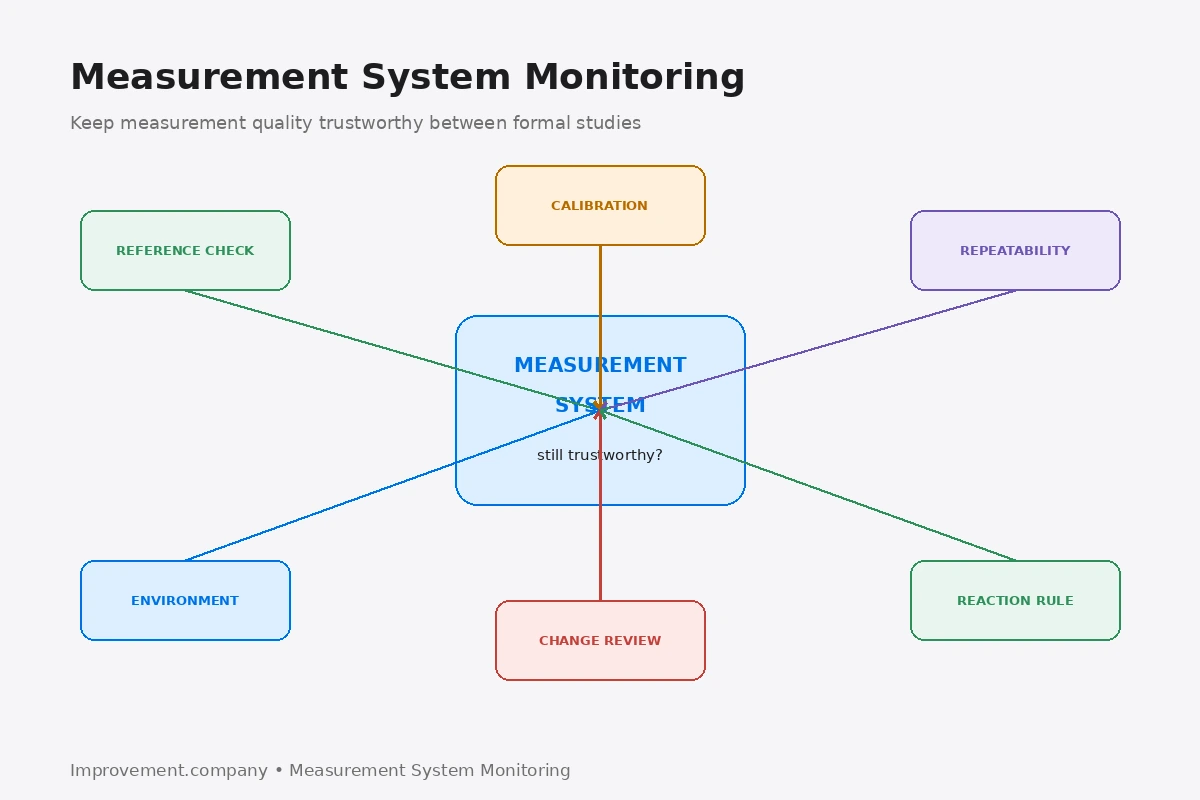
Measurement System Monitoring diagram showing reference checks, calibration, repeatability, environment, change review, and reaction rules around ongoing measurement-system trustworthiness.
Six Sigma & Quality

Measurement System Monitoring: Keep Measurement Quality From Drifting

Learn how Measurement System Monitoring uses reference checks, calibration status, bias signals, repeatability trends, environment, and reaction rules to detect measurement drift.

Measurement System MonitoringSix SigmaQualityMeasurement System
Read guide →
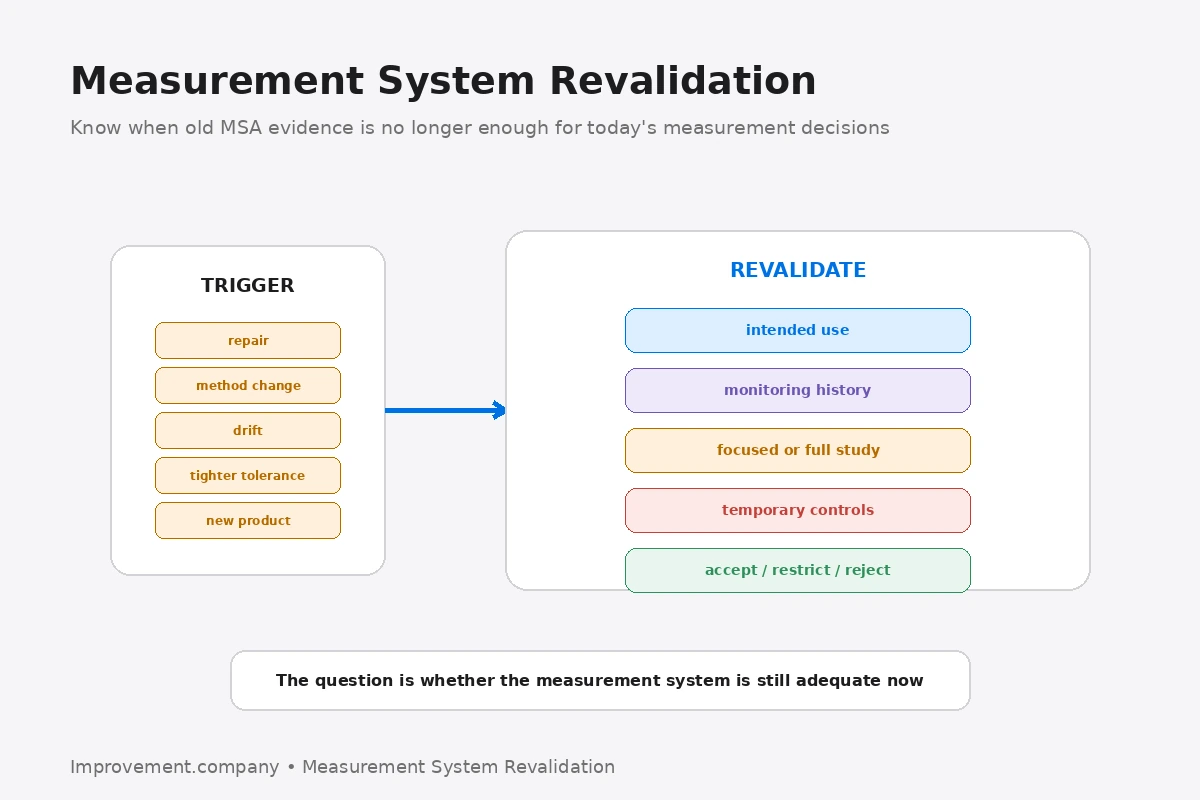
Measurement System Revalidation diagram showing revalidation triggers and decisions about intended use, monitoring history, study scope, temporary controls, and acceptance.
Six Sigma & Quality

Measurement System Revalidation: Know When to Repeat MSA

Learn how Measurement System Revalidation determines when process change, drift, new tolerances, repairs, or method changes require renewed evidence of measurement adequacy.

Measurement System RevalidationSix SigmaQualityMSA
Read guide →
Six Sigma & Quality

Measurement Uncertainty vs Gage R&R: Know the Difference

Learn the difference between measurement uncertainty and Gage R&R, what each method is designed to answer, how they use variation, and when quality teams should use one or both.

Measurement UncertaintyGage R&RMeasurement System AnalysisSix Sigma
Read guide →
Six Sigma & Quality

Operational Definition: Make Measures Mean the Same Thing to Everyone

Learn how an Operational Definition specifies exactly what is measured, counted, classified, and excluded so process data is consistent and usable.

Operational DefinitionSix SigmaMeasurementData
Read guide →
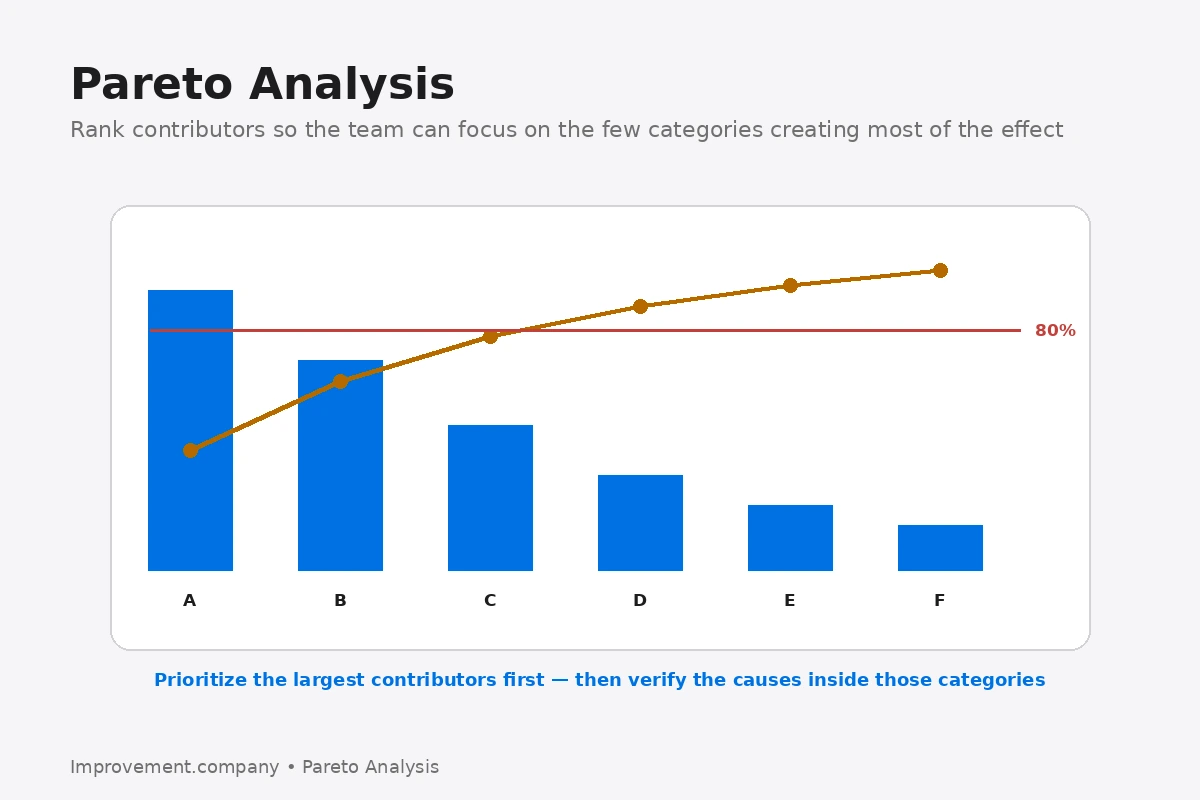
Pareto Analysis diagram showing descending contributors and a cumulative line to focus investigation on the few categories creating most of the effect.
Six Sigma & Quality

Pareto Analysis: Focus on the Few Causes That Matter Most

Learn how Pareto charts prioritize categories by impact, how to build one correctly, what the 80/20 idea means, and when Pareto analysis can mislead.

Pareto AnalysisPareto ChartQualityPrioritization
Read guide →
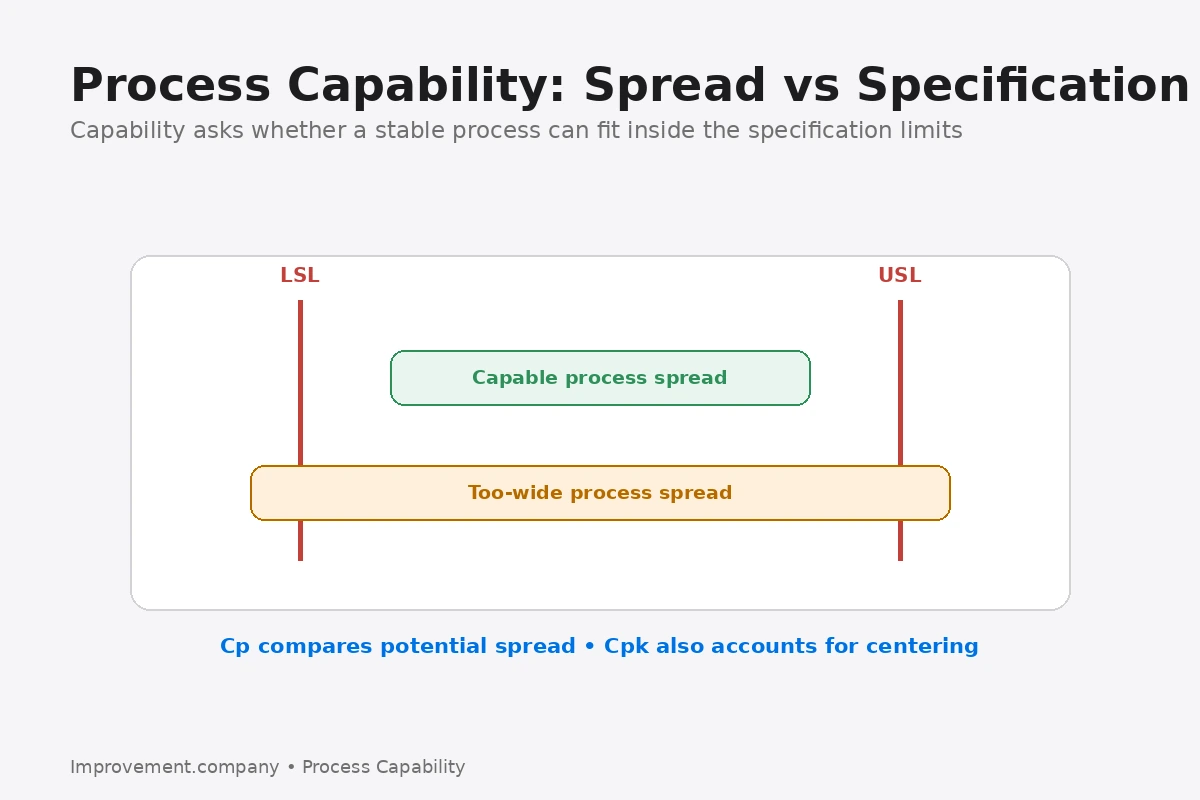
Process capability diagram comparing process spread with lower and upper specification limits.
Six Sigma & Quality

Process Capability: Understand Cp, Cpk and Performance

Learn what process capability means, how Cp and Cpk relate to specification limits, and why capability analysis requires a stable and trustworthy process.

Process CapabilityCpCpkStatistical Process Control
Read guide →
Six Sigma & Quality

Pp and Ppk: Understanding Process Performance

Learn how Pp and Ppk describe overall process performance and how they differ from Cp and Cpk capability measures.

PpPpkProcess PerformanceProcess Capability
Read guide →
Six Sigma & Quality

PPAP: Demonstrate Production Readiness with Objective Evidence

Learn how the Production Part Approval Process uses product, process, measurement, capability, and control evidence to demonstrate manufacturing readiness.

PPAPProduction Part Approval ProcessQualitySupplier Quality
Read guide →
Six Sigma & Quality

Quality at the Source: Build Defect Prevention into the Work

Learn how Quality at the Source shifts responsibility toward preventing and detecting abnormalities where work is performed instead of relying on final inspection.

Quality at the SourceBuilt-in QualityJidokaPoka-Yoke
Read guide →
Six Sigma & Quality

Quality Escape Management: Control Defects That Reached the Customer

Learn how Quality Escape Management protects customers, defines scope, communicates risk, investigates cause, and prevents recurrence after a defect escapes controls.

Quality EscapeCustomer ProtectionQualityContainment
Read guide →
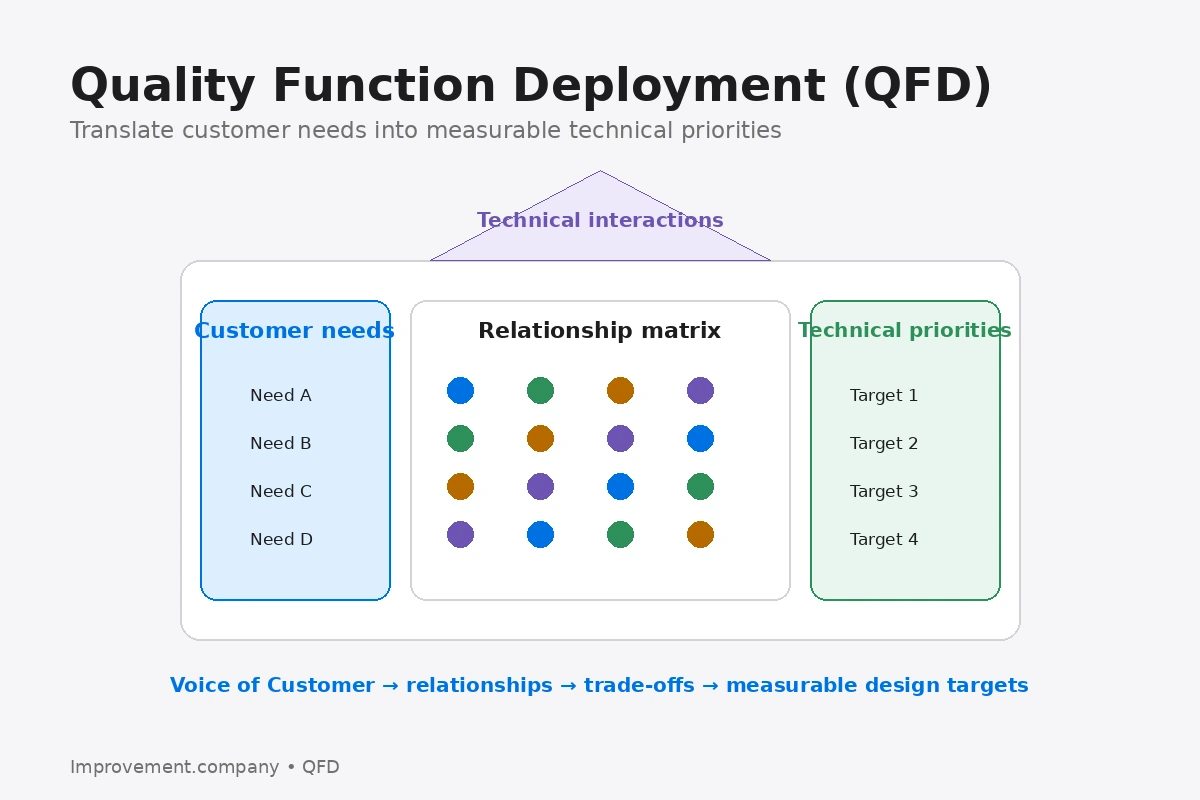
QFD House of Quality logic linking customer needs, relationship scores, technical interactions, and measurable technical priorities.
Six Sigma & Quality

Quality Function Deployment: Translate Customer Needs into Design

Learn how QFD converts customer needs into prioritized technical requirements and helps teams preserve the Voice of the Customer through design decisions.

QFDQuality Function DeploymentVoice of CustomerCTQ
Read guide →
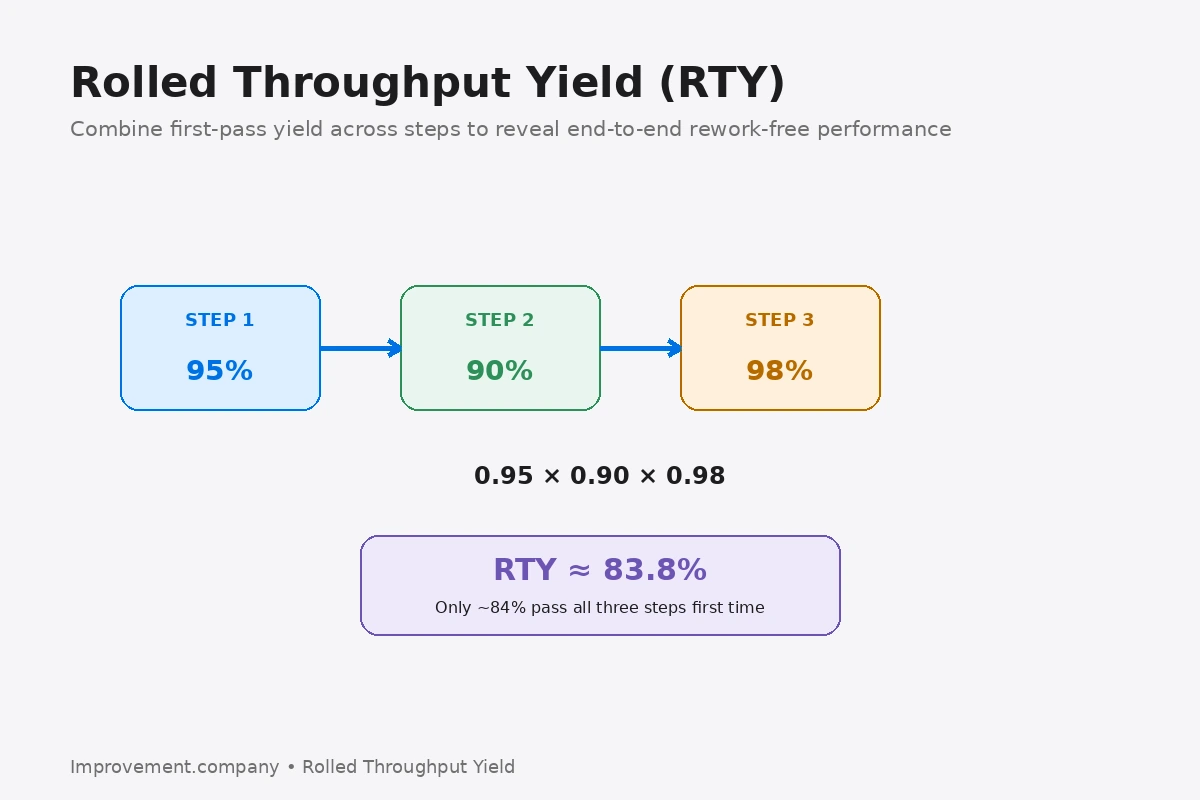
Rolled Throughput Yield diagram showing three first-pass yields multiplied to produce an end-to-end RTY of about 83.8 percent.
Six Sigma & Quality

Rolled Throughput Yield (RTY): Measure End-to-End First-Pass Success

Learn how Rolled Throughput Yield combines first-pass yield across process steps to show the probability that work completes the full process without defect or rework.

Rolled Throughput YieldRTYSix SigmaQuality
Read guide →
Six Sigma & Quality

7 Basic Quality Tools: A Practical Problem-Solving Toolkit

Learn how the 7 Basic Quality Tools support data collection, analysis, prioritization, root-cause exploration, and process control.

7 Basic Quality ToolsQualityProblem SolvingData Analysis
Read guide →
Six Sigma & Quality

Sigma Level: Interpret Process Defect Performance Carefully

Learn how Sigma Level is used to summarize defect performance, how it relates to DPMO, and why assumptions such as the 1.5 sigma shift must be stated explicitly.

Sigma LevelSix SigmaDPMOQuality
Read guide →
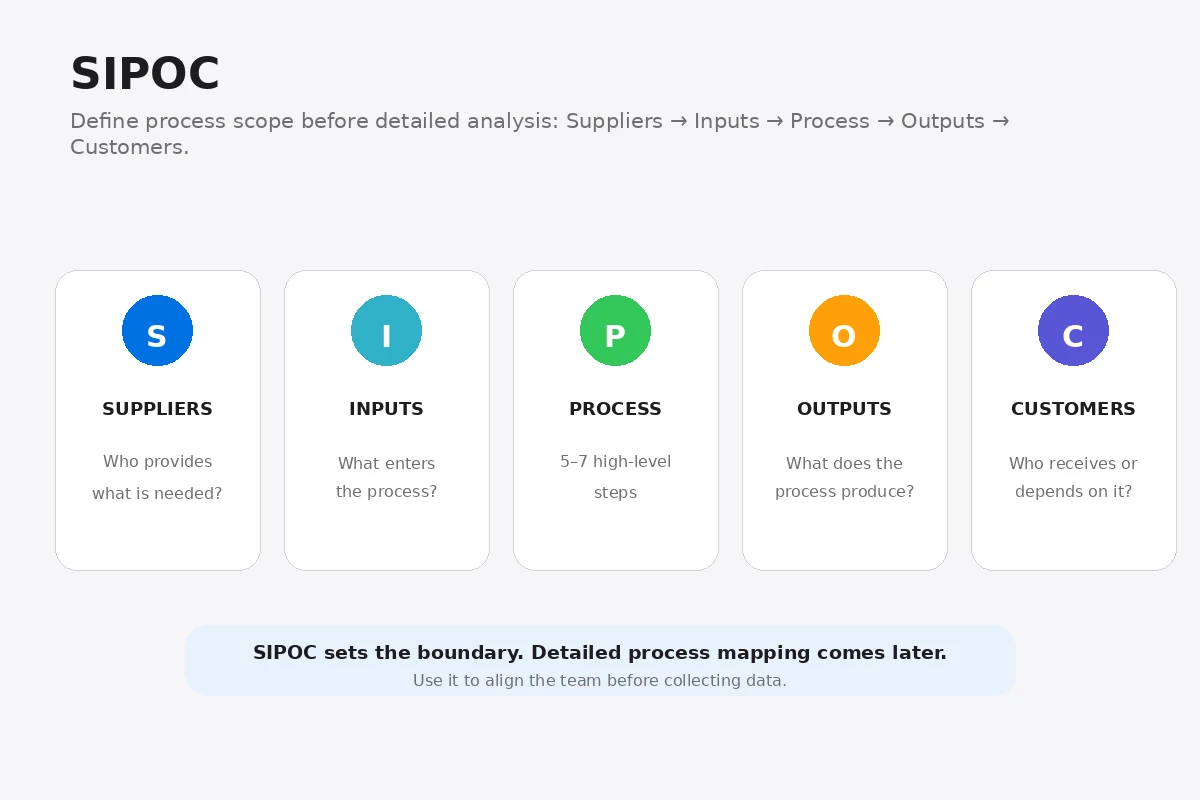
SIPOC high-level process map showing Suppliers, Inputs, Process, Outputs, and Customers
Six Sigma & Quality

SIPOC: Define Process Scope Before Analysis

Use SIPOC to define suppliers, inputs, process boundaries, outputs, and customers before detailed process analysis or DMAIC work begins.

SIPOCDMAICProcess MappingVoice of Customer
Read guide →
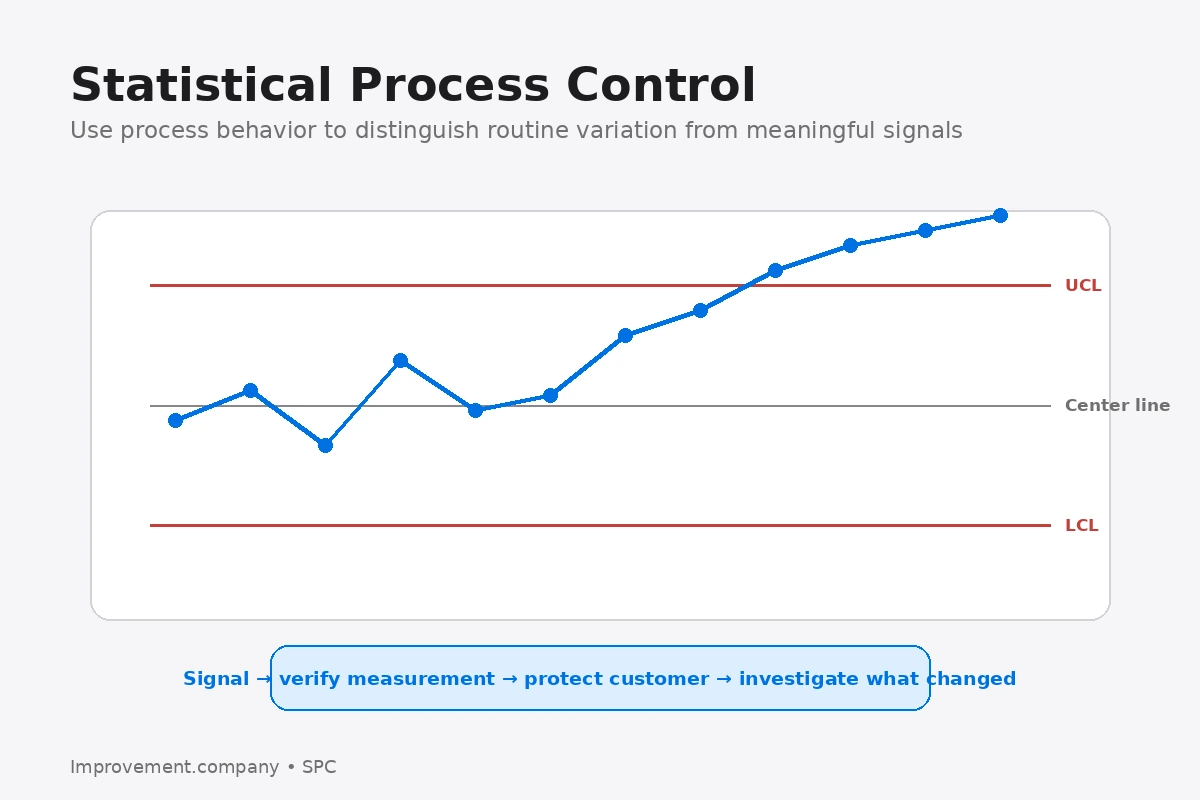
SPC diagram showing process data against upper and lower control limits with an emerging signal requiring investigation.
Six Sigma & Quality

Statistical Process Control (SPC): Manage Variation in Real Time

Learn how Statistical Process Control combines stable measurement, control charts, reaction plans, and process knowledge to manage variation before defects occur.

Statistical Process ControlSPCQualityControl Charts
Read guide →
Six Sigma & Quality

Supplier Quality Management: Control Quality Beyond the Plant

Learn how Supplier Quality Management defines requirements, qualification, monitoring, corrective action, change control, and development across the supply base.

Supplier QualityQuality ManagementSupplier DevelopmentCorrective Action
Read guide →
Six Sigma & Quality

Voice of the Customer (VOC): From Needs to Requirements

Learn how Voice of the Customer captures customer needs, converts them into measurable requirements, and guides improvement priorities.

Voice of CustomerVOCCTQSix Sigma
Read guide →
Six Sigma & Quality

Yield vs First Pass Yield: See Hidden Rework Loss

Learn the difference between final yield and First Pass Yield and why a process can report high final acceptance while still hiding rework and quality loss.

YieldFirst Pass YieldQualityRework
Read guide →