
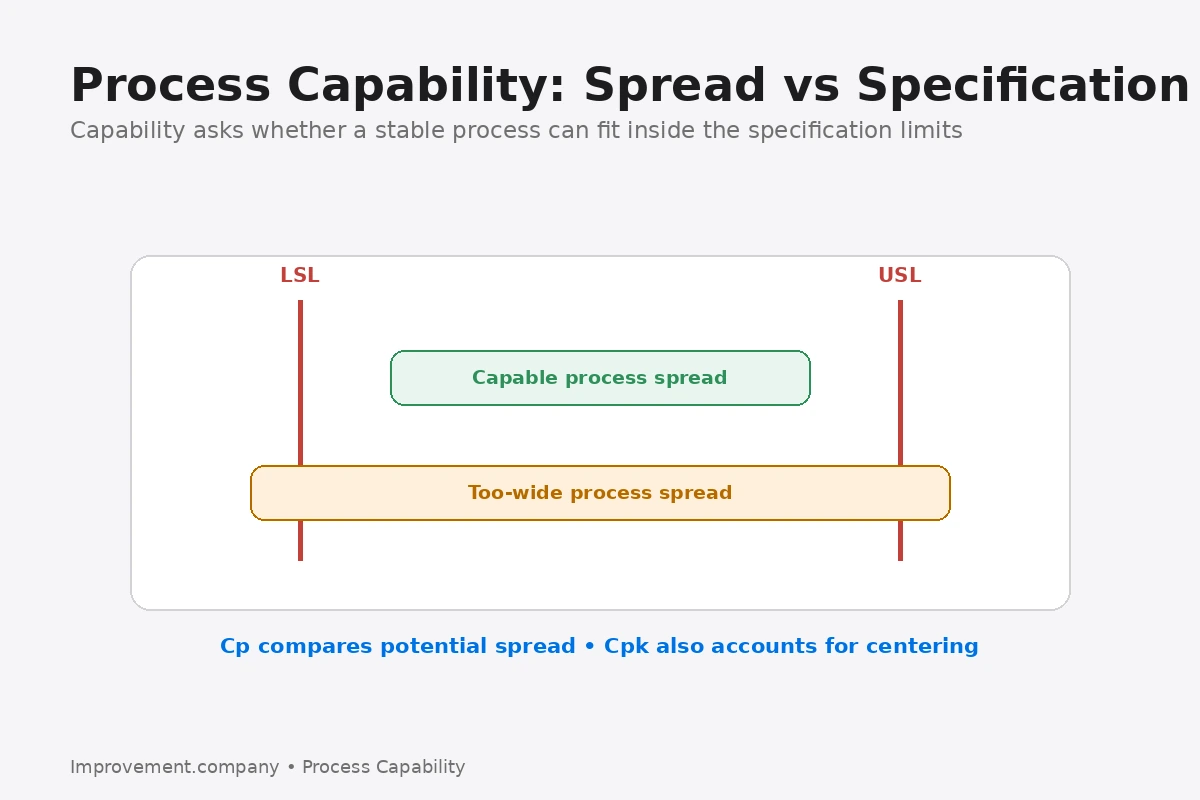
Process capability describes how well the natural variation of a process fits within specification limits.
Capability analysis is commonly summarized with indices such as Cp and Cpk, but the numbers are meaningful only when the data and process conditions are appropriate.
A high capability index does not compensate for an unstable process, a poor measurement system, or an incorrect specification.
Capability compares process variation with specifications
Specifications define what is acceptable from the customer’s or engineering perspective.
Process variation describes what the process actually produces.
Capability analysis compares the width and location of that process distribution with the allowable specification range.
A capable process has enough room between its natural variation and the specification limits to produce acceptable output consistently.
What Cp means
Cp compares the specification width with the estimated natural spread of the process.
In simplified form:
Cp = (USL - LSL) / 6σ
where USL is the upper specification limit, LSL is the lower specification limit, and σ represents process standard deviation.
Cp describes potential capability assuming the process is centered.
It does not indicate whether the process average is close to one specification limit.
That is why Cp should not be interpreted alone.
What Cpk means
Cpk considers both variation and process centering.
It compares the process mean with the nearest specification limit.
In simplified form:
Cpk = minimum of (USL - mean) / 3σ and (mean - LSL) / 3σ
If a process is well centered, Cp and Cpk may be similar.
If Cpk is much lower than Cp, the process may have adequate potential spread but be shifted toward one limit.
This distinction is operationally useful because the corrective action for excessive variation may be different from the action for poor centering.
Stability comes before capability
Before calculating capability, determine whether the process is stable enough for the calculation to represent a predictable condition.
Control Charts help distinguish routine common-cause variation from special-cause signals.
If the process is unstable, a single capability number can hide shifting conditions.
For example, combining several different setups, tools, or material lots into one dataset may produce a capability estimate that represents none of those conditions accurately.
First understand the process behavior. Then evaluate capability.
Confirm the measurement system
Capability analysis also assumes the measurement data are trustworthy.
If the gauge contributes substantial variation, the calculated process spread may reflect the measurement system as much as the process itself.
Measurement System Analysis helps evaluate whether the measurement method is adequate for the decision being made.
This is especially important when tolerances are tight.
Cp and Cpk are not defect rates
Capability indices and actual defect rates are related, but they are not interchangeable.
A capability index is based on assumptions about the process distribution and variation estimate.
Real processes may be non-normal, autocorrelated, mixed, rounded, or affected by changing conditions.
Teams should compare capability results with actual process behavior and defect data rather than assuming the index tells the whole story.
Short-term and long-term performance
Organizations sometimes distinguish capability from performance indices such as Pp and Ppk.
The exact convention can vary, but a common distinction is:
- capability indices use a within-process estimate of variation;
- performance indices use the overall observed variation across the dataset.
If the process shifts over time, long-term performance may be worse than short-term potential.
Always define which method is being used.
Example interpretation
Suppose a machined diameter has specifications of 19.80 mm to 20.20 mm.
The process average is 20.08 mm and its variation is relatively small.
Cp may look strong because the total spread fits comfortably inside the tolerance.
Cpk may be noticeably lower because the process is shifted toward the upper limit.
The correct response may therefore be to investigate centering rather than immediately trying to reduce variation.
Common mistakes
Calculating capability on unstable data
This can produce a precise-looking number for a process that is not predictable.
Ignoring the gauge
Poor measurement can make capability appear worse or better than reality.
Treating 1.33 as a universal law
Many organizations use thresholds such as 1.33 or 1.67, but the appropriate requirement depends on customer expectations, risk, process maturity, and internal standards.
Mixing different process streams
Different machines, cavities, tools, materials, or recipes may need separate analysis.
Using capability to replace problem solving
A low Cpk identifies a performance gap. It does not explain the cause.
Use capability to support decisions
Process capability is most useful when it helps answer a practical question:
Can this stable process consistently meet the required specification?
If not, the next question is why.
Capability analysis works best as part of a larger quality system that includes trustworthy measurement, process stability, root-cause analysis, and verified improvement.
Additional connections
This topic also connects with Pp and Ppk. That relationship is useful when the team needs to extend the method into a wider improvement system.
Related application
This topic also connects with Sigma Level. Use that method when the improvement requires the related operating or management discipline.