
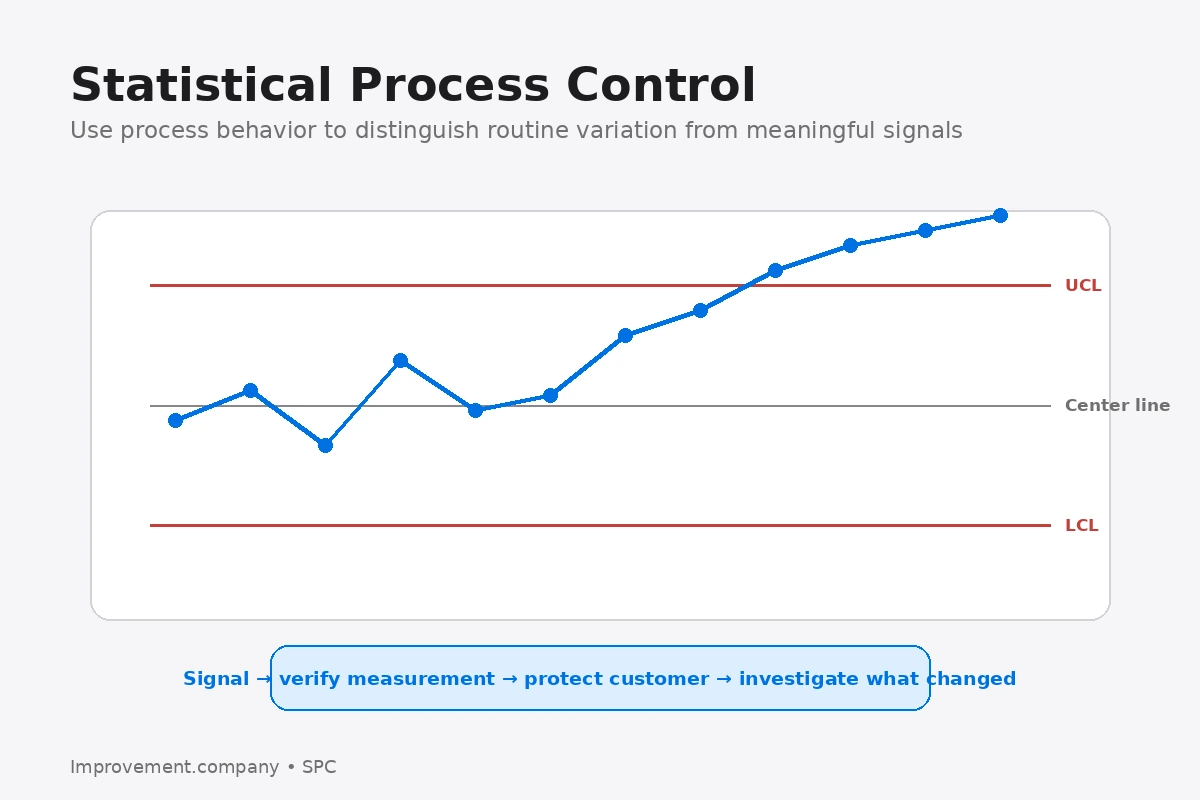
Statistical Process Control, or SPC, is the disciplined use of process data and statistical methods to understand variation and maintain control over a process.
SPC is broader than drawing a control chart.
It includes:
- meaningful measurement;
- stable sampling;
- interpretation of variation;
- reaction rules;
- process knowledge;
- corrective response.
Control Charts are one of the central tools inside SPC.
Start with a meaningful process characteristic
SPC should monitor something that helps the team understand the process.
Examples include:
- diameter;
- fill weight;
- temperature;
- torque;
- cycle time;
- defect proportion.
The measurement should connect to process performance or customer requirements.
Critical to Quality helps identify characteristics that matter to the customer or downstream process.
Verify the measurement system
A control chart cannot rescue unreliable measurement.
Before relying on small changes in the data, confirm that the measurement method is appropriate.
Measurement System Analysis evaluates whether the measurement process contributes too much variation to the observed result.
If measurement variation is large, the team may chase noise created by the gage.
Understand common and special causes
SPC distinguishes two broad types of variation.
Common-cause variation comes from the current system.
Special-cause variation indicates that something unusual changed.
The response should differ.
For a special cause, investigate what changed.
For an incapable but stable process, improve the system rather than searching for a special event that does not exist.
Use rational sampling
Samples should represent the process in a way that makes changes visible.
Poor sampling can mix unlike conditions and hide signals.
Consider:
- time;
- cavity;
- machine;
- operator;
- material lot;
- product family.
The sampling plan should reflect how the process actually varies.
Define a reaction plan
A signal is useful only if the team knows what to do.
A reaction plan may include:
- protect the customer;
- verify the measurement;
- identify what changed;
- restore the known condition;
- document the cause;
- escalate if the cause cannot be removed.
Control Plan can define the control method and reaction required when the process becomes abnormal.
Do not confuse control limits with specification limits
Specification limits describe what the customer or design requires.
Control limits describe the behavior of the process.
A process can be:
- stable but incapable;
- unstable but currently within specification;
- stable and capable.
Process Capability should be evaluated only after the process is sufficiently stable for the calculation to be meaningful.
Use SPC at the process, not only in Quality
The people closest to the work should understand what the signal means.
SPC is strongest when operators and supervisors can:
- recognize abnormal patterns;
- follow the reaction plan;
- preserve evidence;
- avoid unnecessary adjustment.
A chart that is reviewed only at the end of the month is not functioning as real-time process control.
Avoid tampering
Adjusting a stable process after every small fluctuation can increase variation.
SPC helps prevent this behavior by distinguishing routine variation from meaningful signals.
The team should adjust the process because there is evidence of a change, not because the latest point looks different.
Common mistakes
Using unreliable measurement, treating specification limits as control limits, charting data without a reaction plan, mixing incompatible products in one chart, reacting to every point, calculating capability on an unstable process, and keeping charts as Quality paperwork instead of operating tools are common mistakes.
Practical sequence
- select a meaningful characteristic.
- verify the measurement system.
- define rational sampling.
- choose an appropriate control chart.
- establish baseline behavior.
- train the team on signals.
- define a reaction plan.
- investigate special causes.
- improve stable but incapable processes.
- maintain the chart as part of daily process control.
The practical lesson
SPC turns process data into operating decisions.
The value is not the chart itself. The value is knowing when the process changed, when it did not, and what response is appropriate.