
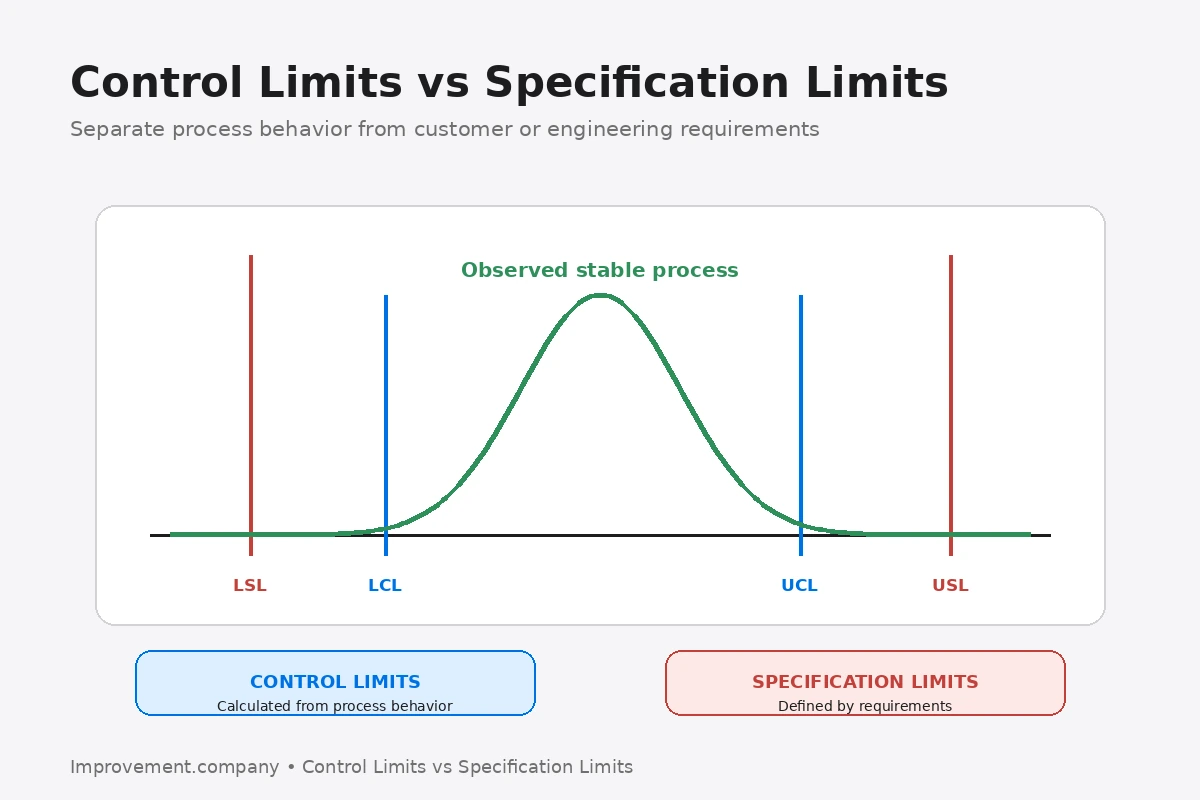
Control limits and specification limits answer different questions.
Confusing them can lead teams to make the wrong decision about process stability and capability.
The simplest distinction is:
- control limits describe process behavior;
- specification limits describe requirements.
Control limits come from process data
Control limits are calculated from observed process variation using the logic of the selected control chart.
Control Charts help determine whether process variation appears stable over time or whether special-cause signals are present.
The limits are not normally set by the customer.
They describe the expected range of a stable process statistic.
Specification limits come from requirements
Specification limits define acceptable output.
They may come from:
- customer requirement;
- engineering design;
- regulation;
- internal functional requirement.
Examples include:
- diameter between 9.90 and 10.10 mm;
- response time below 2 seconds;
- temperature between approved limits.
Specifications do not describe how the process currently behaves.
A process can be stable but incapable
A stable process may remain statistically predictable while still producing output outside specification.
For example, the process average may be centered poorly or natural variation may be too wide.
Process Capability compares stable process variation with specification limits.
Stability should normally be understood before capability indices are interpreted.
A process can be unstable and temporarily inside specification
A process may currently produce acceptable output while showing special-cause signals.
That means the future process behavior is less predictable.
Statistical Process Control helps detect changes in process behavior before relying only on product acceptance.
Being inside specification today does not prove the process is stable.
Do not place specification limits on a control chart as substitutes
Specifications may be displayed for reference, but they should not replace statistically calculated control limits.
A point outside specification means the output does not meet requirement.
A point outside a control limit means the process behavior contains a statistical signal.
Those are different conclusions.
Use the correct response
When a point violates a specification:
- protect the customer;
- contain affected output;
- follow quality disposition rules.
Control of Nonconforming Output helps prevent unintended use or delivery of suspect output.
When a control-chart signal occurs:
- verify the measurement;
- investigate what changed;
- restore statistical stability.
The two conditions can occur together or separately.
Avoid adjusting a stable process unnecessarily
If operators adjust the process every time a point moves within normal control limits, they can increase variation.
This is sometimes called tampering.
The control chart should help distinguish routine variation from meaningful signals.
Connect capability improvement to the right problem
If a process is stable but too wide relative to specifications, reduce common-cause variation.
If the process is unstable, identify and remove special causes first.
Process Performance Pp/Ppk can describe longer-term performance, but the interpretation should still respect the difference between requirements and process behavior.
Common mistakes
Using specification limits as control limits, assuming an in-spec process is stable, calculating capability on an unstable process without caution, reacting to every routine fluctuation, and treating a control-limit signal as automatically defective product are common mistakes.
Practical sequence
- define the specification limits.
- collect reliable process data.
- select the appropriate control chart.
- calculate control limits from process behavior.
- investigate statistical signals.
- protect the customer from specification violations.
- establish process stability.
- evaluate capability relative to specifications.
- reduce common-cause variation where needed.
- keep process-behavior and requirement decisions separate.
The practical lesson
Control limits tell you how the process behaves.
Specification limits tell you what the output must meet.
Good process management requires understanding both without confusing them.