
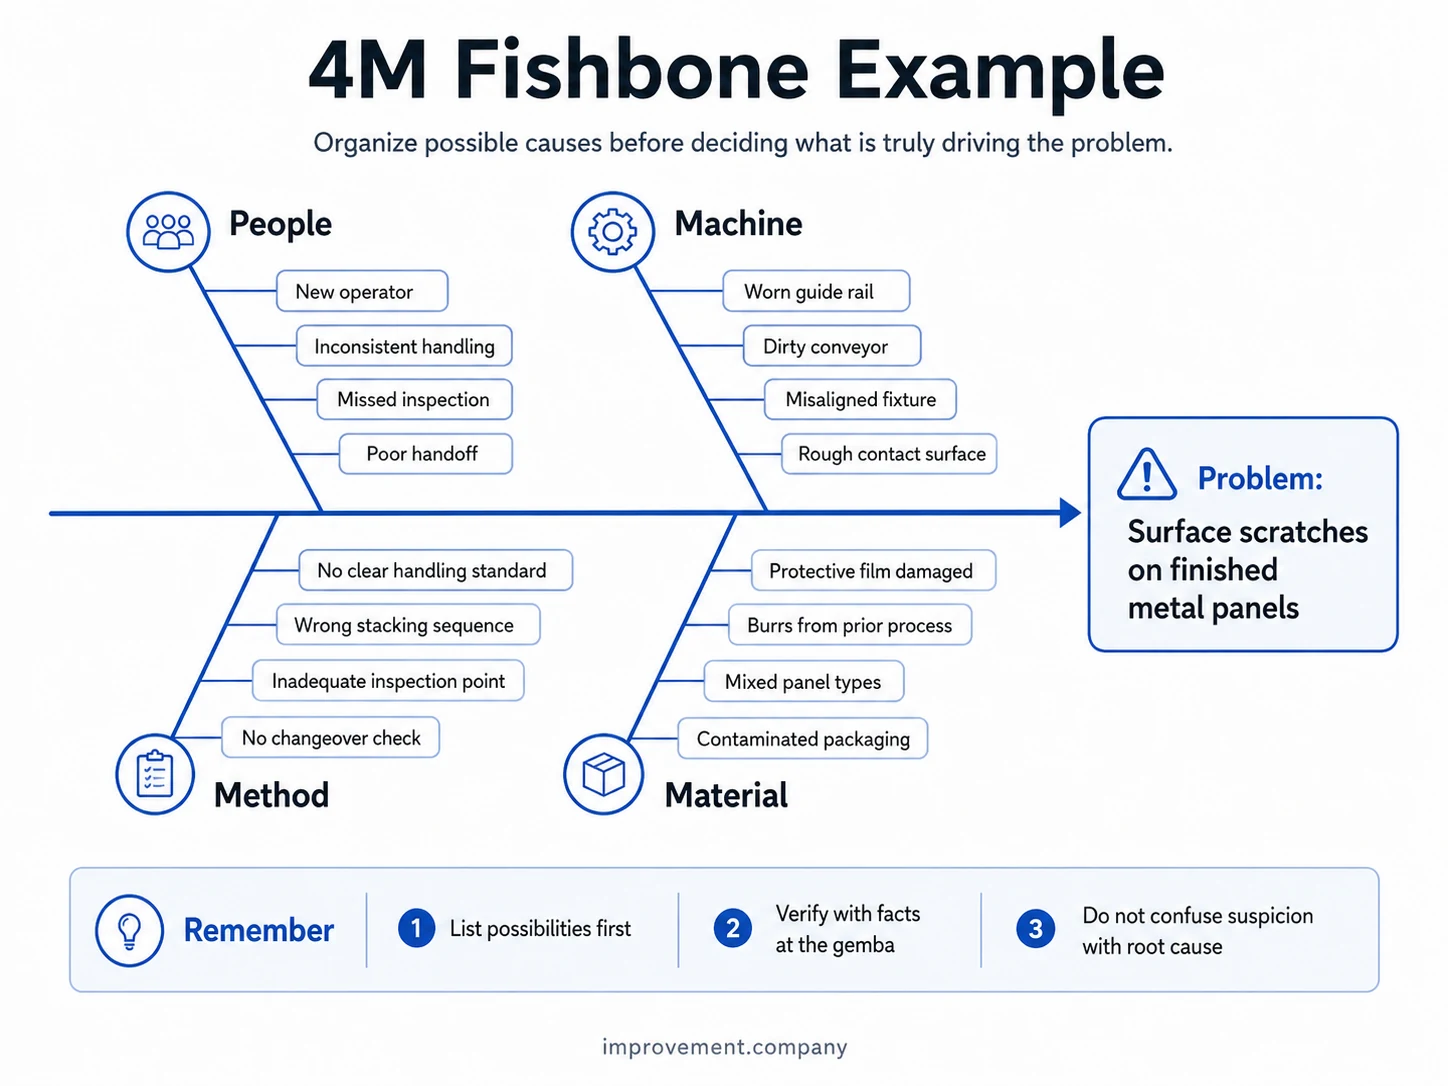
4M Analysis is a practical way to organize possible causes of a manufacturing or process problem before the team decides what is actually driving it.
The four categories are People, Machine, Method, and Material. Traditional versions often use Man, Machine, Method, and Material; using People keeps the same analytical intent while using clearer modern language.
The method is simple enough for a short shop-floor investigation, but it becomes much more powerful when the team treats the four categories as a starting structure rather than a substitute for evidence.
What the 4Ms help you investigate
A process problem rarely has only one possible explanation. The 4M structure reduces the risk of focusing on the first idea that sounds plausible.
| Category | What to investigate | Typical examples |
|---|---|---|
| People | Skills, training, staffing, communication, fatigue, handoffs, adherence to standard work | New operator, incomplete training, unclear responsibility, rushed changeover |
| Machine | Equipment condition, settings, tooling, sensors, wear, utilities, maintenance history | Worn guide, loose sensor, unstable temperature, incorrect pressure |
| Method | Work sequence, setup method, inspection method, standard work, reaction plan | Missing check, outdated instruction, inconsistent sequence, unclear setup criteria |
| Material | Raw material, components, packaging, consumables, supplier variation, storage | Wrong grade, mixed lot, damaged component, moisture exposure |
The four groups are not intended to prove the cause. They help the team organize what should be checked.
Start with the problem, not the fishbone
A weak problem statement produces weak cause analysis.
Statements such as “the machine is bad,” “quality is poor,” or “the operator made a mistake” already contain assumptions. They encourage the team to defend a conclusion instead of studying the gap.
A stronger problem statement describes the observable condition:
Line 2 produced 4.8% surface scratches on Product A during the night shift, compared with the normal rate below 0.5%.
A useful problem statement normally identifies the process or product, the location, the time or operating condition, the failure mode, and the gap from the expected condition.
Before listing causes, go to the Gemba and confirm that the team is solving the problem that actually occurred.
Build the 4M fishbone
The fishbone format is useful because it makes the team’s thinking visible.
Create four major branches for People, Machine, Method, and Material. Then add recent changes, observed abnormalities, and realistic possible causes beneath the appropriate branch.
At this stage, the goal is coverage, not agreement.
For example, if the team initially believes a defect is caused by an operator, the 4M structure forces it to also consider equipment condition, process method, and material variation. That simple discipline can prevent premature blame.
The same principle works in reverse. A failure that looks mechanical may still involve an incorrect setup method, missing inspection point, or material change.
For more detail on the diagram itself, see the Fishbone Diagram.
Separate facts from assumptions
This is one of the most important disciplines in 4M Analysis.
Consider two statements:
- “A new operator was assigned to the night shift.”
- “The new operator caused the defect.”
The first can be verified from staffing records. The second is a causal conclusion that still requires evidence.
The team should mark possibilities as suspected, verified, or eliminated rather than allowing every item on the fishbone to become an accepted root cause.
This makes the analysis much more useful for later Root Cause Analysis.
Verify likely causes at the process
Once the possibilities are visible, investigation begins.
Verification may include direct observation, measurement, comparison between good and bad conditions, inspection of equipment, review of maintenance history, material lot comparison, setup records, process data, or controlled testing.
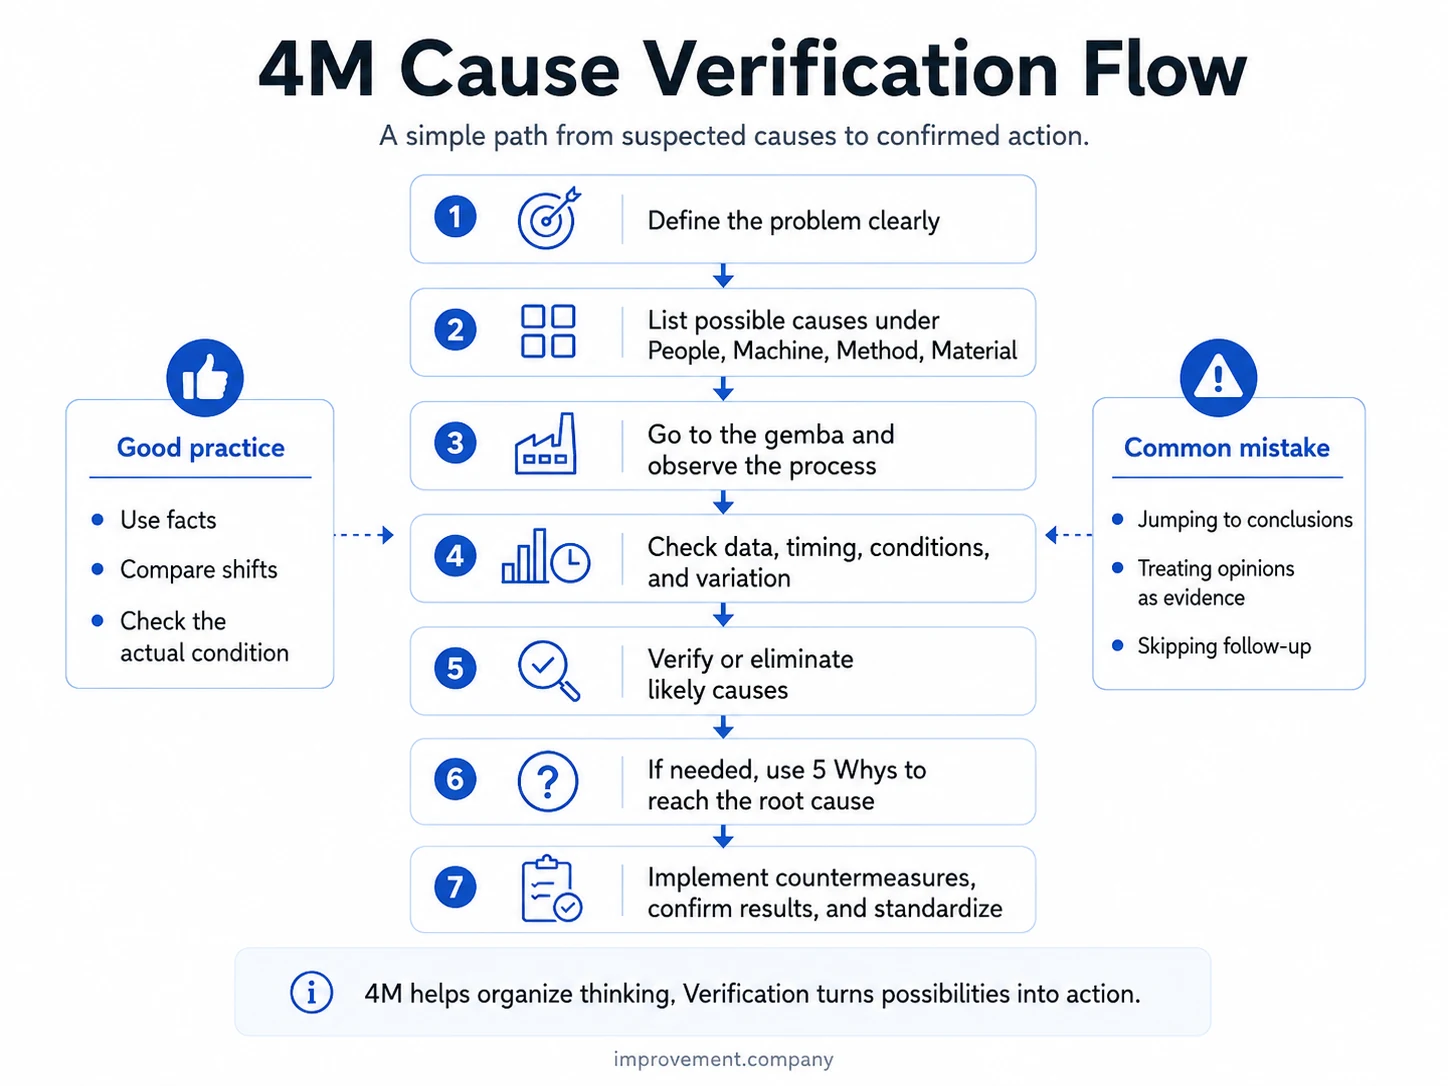
A practical sequence is:
- Define the problem clearly.
- List possible causes under the four categories.
- Observe the actual process condition.
- Check data, timing, changes, and variation.
- Verify or eliminate the likely causes.
- Use deeper analysis where necessary.
- Implement countermeasures and confirm the result.
If the evidence points toward one causal path but the explanation is still too shallow, use 5 Whys to investigate further.
For a larger cross-functional problem, the same findings can become part of an A3 or another structured problem-solving process.
Worked example: inconsistent label placement
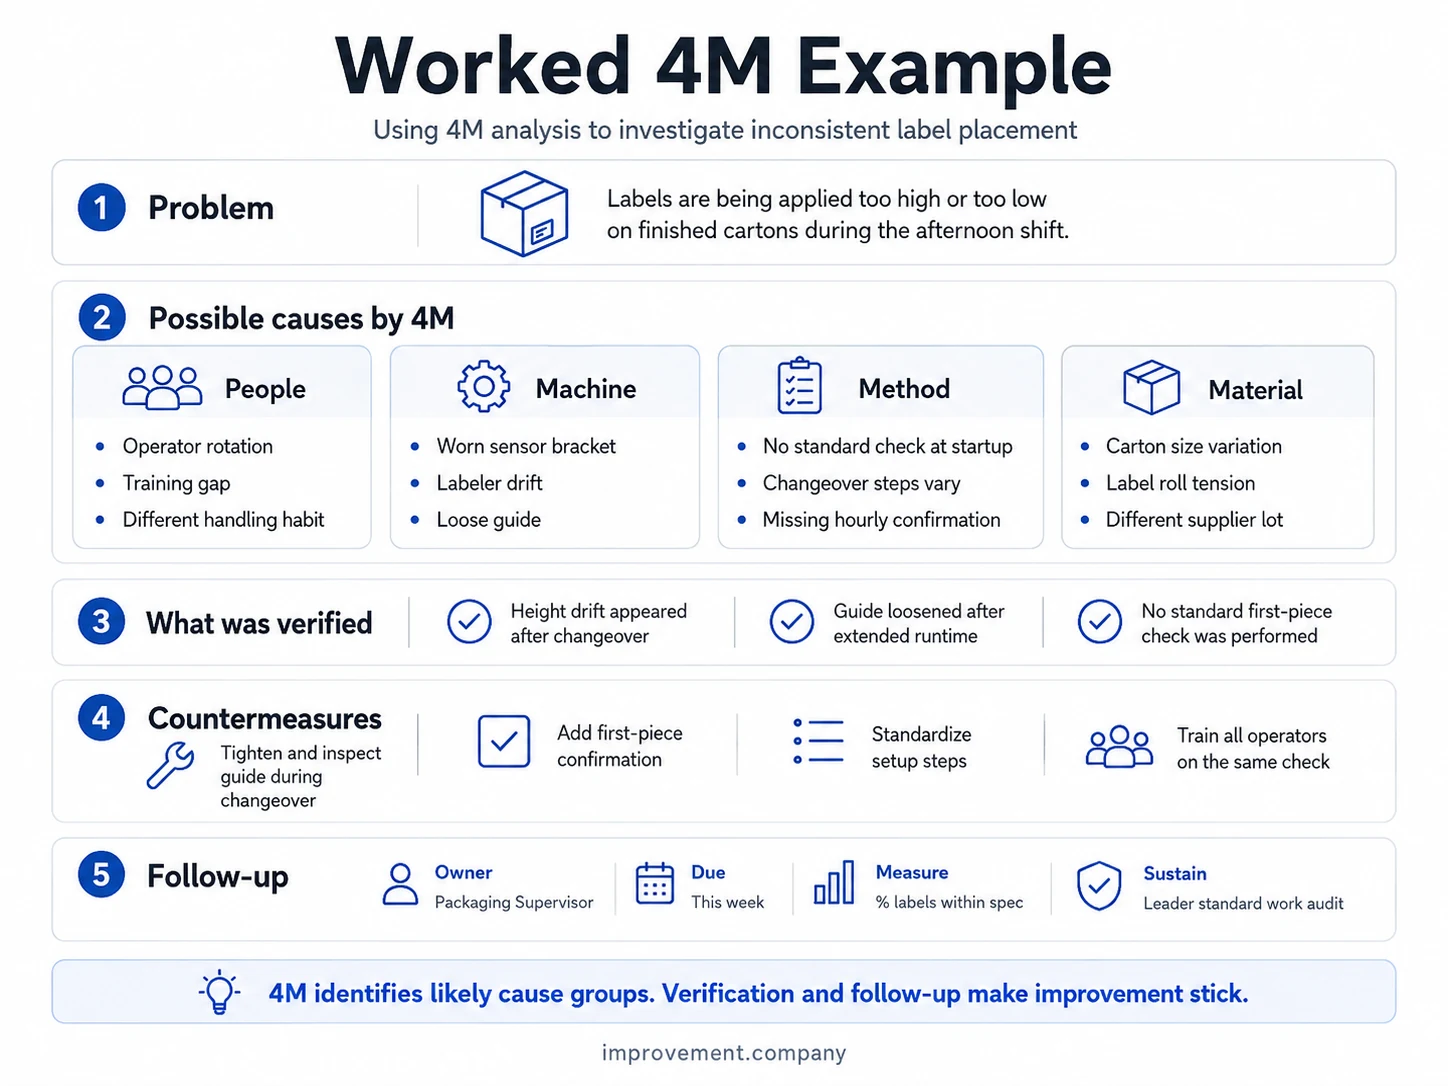
Suppose finished cartons begin leaving a packaging line with labels positioned too high or too low, particularly on the afternoon shift.
The first reaction might be to retrain the operator. A 4M review gives the team a broader starting point.
People: operator rotation, training gap, different handling habits.
Machine: worn sensor bracket, labeler drift, loose guide.
Method: no standard check at startup, variation in changeover sequence, missing hourly confirmation.
Material: carton-size variation, label-roll tension, different supplier lots.
After observing the process and reviewing the timing of failures, the team verifies that height drift appears after changeover, the guide can loosen during extended runtime, and no standard first-piece confirmation is required.
The countermeasure should therefore address the process conditions:
- tighten and inspect the guide during changeover;
- add a first-piece confirmation;
- standardize the setup sequence;
- train all operators on the same verification step;
- follow the result using the percentage of labels within specification.
This is stronger than telling people to “be more careful” because the process itself changes.
Possible cause, verified cause, root cause, and countermeasure
These terms are related but should not be treated as interchangeable.
A possible cause is something that could plausibly contribute to the problem.
A verified cause is supported by evidence showing a relationship with the observed condition.
A root cause is a causal mechanism deep enough that addressing it prevents or materially reduces recurrence. Some problems have more than one meaningful root cause.
A countermeasure is the action selected to change the cause or control the risk.
The 4M diagram mostly helps with the first stage. Verification and deeper analysis determine whether a possible cause deserves to become part of the corrective-action plan.
When 4M is enough
4M can be enough when the problem is relatively contained, the causal mechanism becomes clear quickly, and a low-risk countermeasure can be verified directly.
Typical examples include:
- a recurring defect after one specific setup;
- a minor machine stop linked to an observable condition;
- a missing inspection step;
- a material mix-up;
- a clear handoff failure.
In these situations, a long formal investigation may add paperwork without adding understanding.
When to go deeper
Move beyond 4M when the problem is high risk, cross-functional, statistically complex, intermittent, expensive, or poorly understood.
Useful next methods include:
- 5 Whys for a relatively direct causal chain;
- Fishbone Diagram when a broader set of cause branches must be explored;
- A3 Problem Solving when the investigation needs a structured story and management follow-up;
- DMAIC when measurement, variation, and statistical analysis are central;
- FMEA when the team needs to evaluate and reduce future risk.
For equipment-related findings, the corrective action may also connect to Planned Maintenance. If the best solution prevents the error at the source, consider Poka-Yoke.
Common mistakes
Treating the 4M list as the final answer
A full fishbone is not evidence. The categories create hypotheses that still need verification.
Defaulting to People
“Operator error” often describes where a problem became visible, not why the system allowed it to happen.
Check training, instructions, equipment design, work sequence, material condition, and error-proofing before making the person the final cause.
Writing causes that are too broad
“Poor maintenance” is difficult to act on.
“No inspection criterion exists for conveyor-guide wear” is more specific, observable, and correctable.
Choosing countermeasures before verification
Teams sometimes start implementing their favorite solutions while the cause analysis is still incomplete.
This can consume time without changing recurrence.
Closing the analysis after implementation
A countermeasure is not proven because it was completed.
The team should define what result is expected, monitor the process afterward, and confirm that the gap has actually closed.
A practical 4M checklist
Before closing the analysis, ask:
- Is the problem statement specific and measurable?
- Did we observe the actual process?
- Did we review all four categories?
- Did we identify recent changes?
- Did we separate facts from assumptions?
- Did we verify the most likely causes?
- Do the countermeasures change the process rather than only reminding people?
- Is every action assigned to an owner?
- Is there a due date?
- Did we define how effectiveness will be checked?
- Did successful learning update Standard Work, maintenance, training, or another control?
The purpose of 4M Analysis
4M Analysis is valuable because it slows down one dangerous part of problem solving: jumping to a conclusion too early.
The method gives the team a simple structure for looking across human, equipment, process, and material factors. But the real quality of the analysis comes from what happens next: observation, evidence, cause verification, countermeasures, and follow-up.
The best 4M analysis is not the diagram with the most branches. It is the one that helps the team understand what changed, verify what is driving the problem, and make recurrence less likely.