
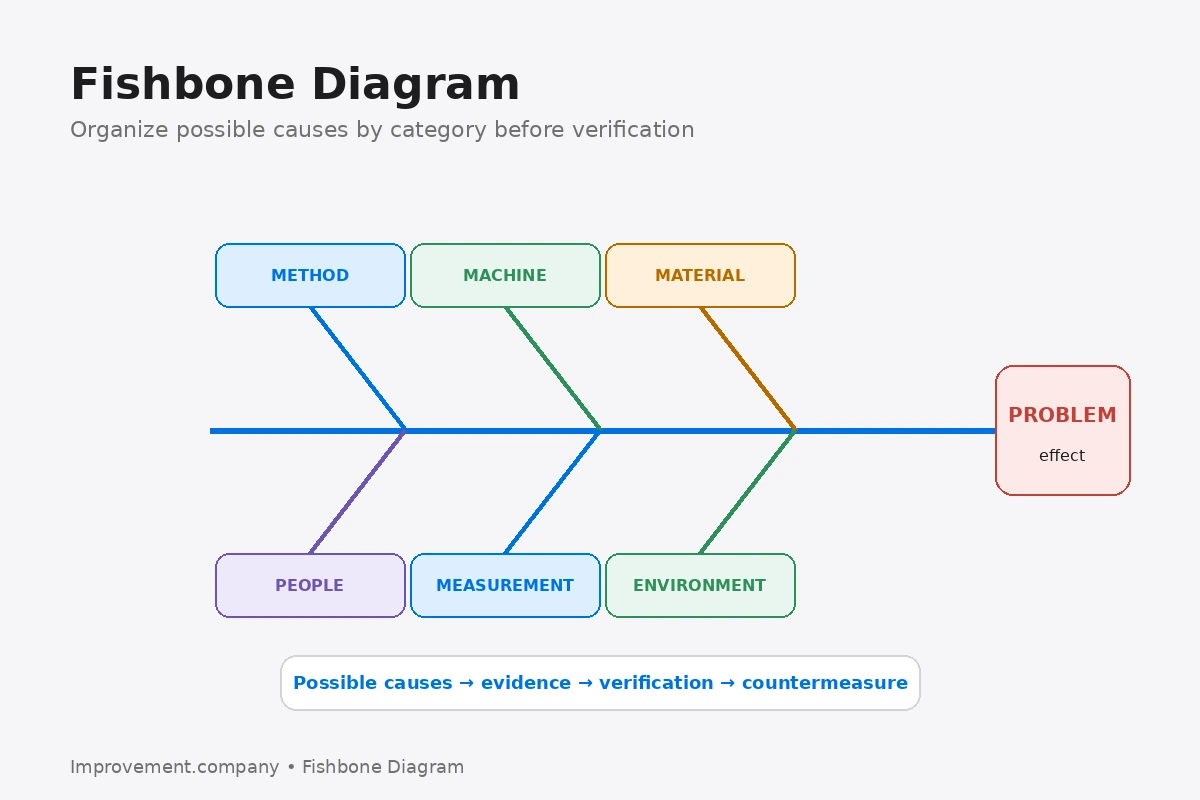
A fishbone diagram, also called an Ishikawa or cause-and-effect diagram, is a structured way to organize possible causes of a defined problem. The problem is written at the head of the diagram, while major cause categories form the larger branches and specific possibilities are added beneath them.
The method is useful because it helps a team broaden its thinking before deciding which causes deserve verification.
Start with a specific effect
The diagram should begin with a clearly defined problem.
A statement such as “quality is bad” is too broad. A stronger effect describes the actual gap, such as a repeated scratch on a defined product surface or a missed delivery condition on a particular process.
A precise effect helps the team generate causes that are relevant to the problem rather than generic concerns.
Use categories to structure thinking
Manufacturing teams often use the 4M categories: Manpower, Machine, Material and Method.
Some versions expand this to 6M by adding Measurement and Mother Nature, often interpreted as environment.
The labels are only a framework. Service or administrative processes may use different categories that better match the work.
The purpose is to prevent the team from looking in only one familiar direction.
Brainstorm possibilities, not conclusions
Items placed on the fishbone are possible causes.
They should not be treated as proven simply because several people agree that they sound reasonable.
A useful team asks what evidence would show whether each important possibility is actually related to the effect.
This keeps the diagram from becoming a voting exercise.
Go deeper where needed
A broad branch such as “machine” may not be actionable.
The team can ask why that machine condition could create the observed effect and continue adding more specific branches.
This creates useful depth without forcing every causal chain into exactly five levels.
The goal is enough detail to identify hypotheses that can be checked.
Prioritize before investigating everything
A large fishbone can contain dozens of possible causes.
Investigating every branch equally may waste time.
Teams can use process knowledge, data, Gemba observation and risk to select the most plausible or consequential possibilities for verification first.
This is where Pareto analysis, stratification or simple data collection can complement the diagram.
Common mistakes
One mistake is writing solutions on the diagram instead of causes.
Another is stopping at vague labels such as “operator” or “training.” Those labels do not explain the process condition that produced the problem.
A third mistake is using the diagram as final proof.
The fishbone organizes thinking. It does not replace verification.
From fishbone to root cause
After possible causes are organized, the team should test the important ones.
A verified cause should explain the problem and lead toward a countermeasure that changes the relevant mechanism.
If the countermeasure works and recurrence is prevented, the analysis has created value.
A fishbone diagram is therefore best understood as a bridge between problem definition and evidence-based root cause analysis.
Connect this concept to the wider system
For deeper application, connect this concept with Root Cause Analysis, 5 Whys, and A3 Problem Solving. These methods help move from understanding the topic to managing it as part of a wider improvement system.
Related application
This topic also connects with Cause-and-Effect Matrix. Use that method when the improvement requires the related operating or management discipline.