
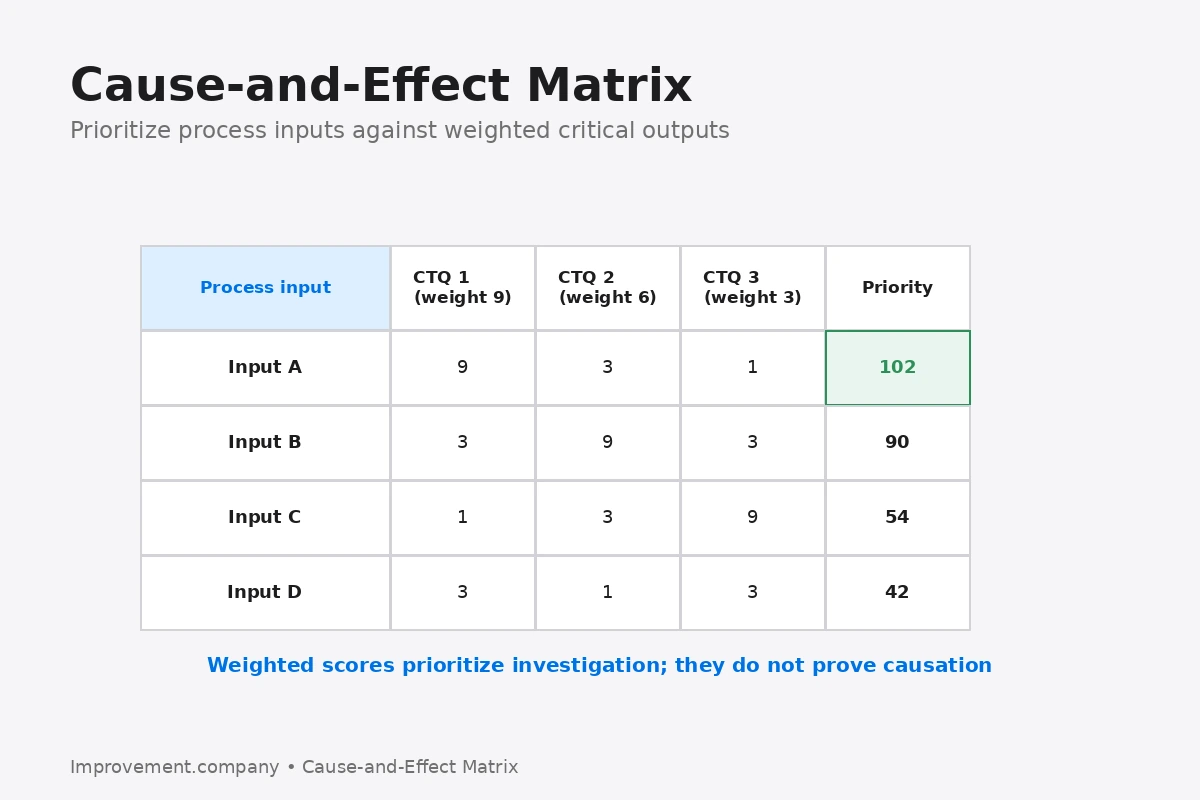
A Cause-and-Effect Matrix is a prioritization tool used to connect process inputs with important outputs.
It is sometimes called a C&E Matrix or X-Y Matrix.
The method helps a team decide which process variables deserve deeper investigation when many possible inputs could influence the result.
Start with critical outputs
The team first identifies the outputs that matter.
Examples include:
- defect rate;
- strength;
- delivery time;
- dimensional accuracy;
- customer response time.
Critical to Quality can help translate customer needs into measurable outputs.
Each output can be assigned an importance weight.
For example, a safety-critical output may receive more weight than a minor cosmetic characteristic.
List meaningful process inputs
Inputs may include:
- temperature;
- pressure;
- material lot;
- fixture condition;
- speed;
- training;
- sequence;
- inspection method.
Process Mapping can help the team identify inputs at each step of the process.
The matrix should focus on plausible inputs, not every variable that can be imagined.
Score the relationship
The team evaluates how strongly each input may affect each output.
A simple scale may use:
- 0 = little or no relationship;
- 1 = weak relationship;
- 3 = moderate relationship;
- 9 = strong relationship.
The exact scale can vary.
Consistency matters more than the specific numbers.
Calculate weighted priority
For each input:
Priority score = Σ(output importance × relationship score)
The resulting total helps rank the inputs.
A high score does not prove causation.
It indicates where investigation may be most valuable.
Use evidence during scoring
The matrix should not become a voting exercise based only on opinion.
Useful evidence may include:
- process data;
- engineering knowledge;
- prior failures;
- experiments;
- Gemba observation.
If the team strongly disagrees on a relationship, that disagreement may identify an assumption that needs testing.
Understand the difference from a fishbone diagram
A Fishbone Diagram helps organize possible causes.
A Cause-and-Effect Matrix goes further by relating inputs to defined outputs and creating a relative priority.
The matrix is therefore useful when the team already has many possible variables and needs focus.
Connect to FMEA and DOE
High-priority inputs may deserve deeper risk analysis.
FMEA can examine how those inputs could fail and what controls exist.
For complex relationships, Design of Experiments may be used to test which factors actually influence the response.
The matrix helps narrow the field before more resource-intensive analysis.
Avoid false precision
A score of 270 is not scientifically proven to be exactly three times more important than a score of 90.
The numbers organize thinking.
They do not replace evidence.
Use the ranking to guide investigation, then verify actual relationships.
Common mistakes
Using vague outputs, listing too many inputs, scoring without process knowledge, treating the ranking as proof of root cause, allowing one strong personality to dominate the scoring, and failing to test high-ranked variables are common mistakes.
Practical sequence
- define the important outputs.
- weight the outputs.
- identify meaningful process inputs.
- score input-output relationships.
- calculate weighted totals.
- review major disagreements.
- rank the inputs.
- investigate high-priority variables.
- verify causal relationships.
- use deeper tools where necessary.
The practical lesson
A Cause-and-Effect Matrix helps a team reduce a long list of possible inputs to a focused investigation plan.
It prioritizes where to look next; it does not declare the root cause.