
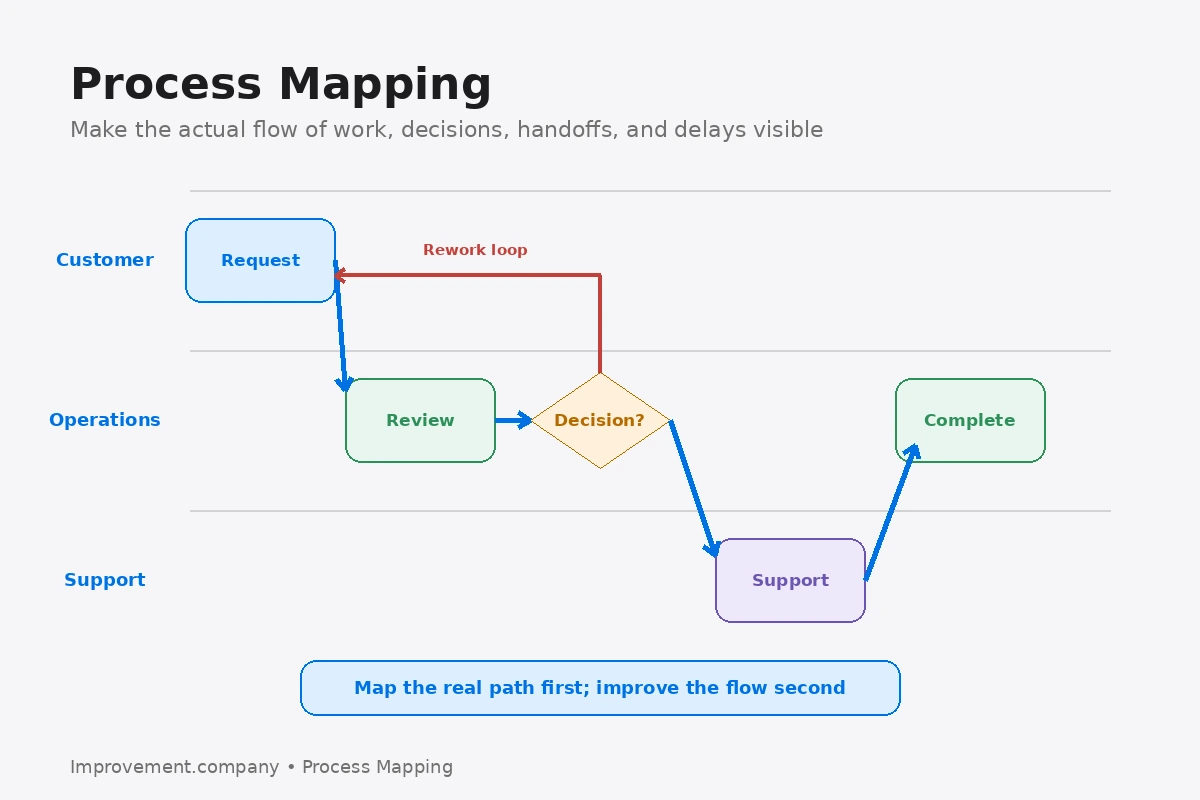
Process mapping is a visual method for showing how work moves from one step to another.
A map can show activities, decisions, handoffs, queues, rework loops, inputs, outputs, and ownership.
Its purpose is not to create a beautiful diagram.
Its purpose is to make the process visible enough that people can understand how the work actually happens and where improvement is needed.
Why process mapping matters
Processes are often understood differently by different people.
One employee may describe the official procedure. Another may describe the actual work. A manager may understand only the major steps. A customer may experience the process through delays, errors, or repeated requests for information.
A process map gives the team a common picture.
It can expose:
- duplicate work;
- unclear ownership;
- excessive approvals;
- handoff delays;
- unnecessary movement;
- rework;
- missing information;
- decision points;
- inconsistent methods.
This makes process mapping a useful starting point for Continuous Improvement.
Start with scope
Before drawing, define:
- where the process starts;
- where it ends;
- who the customer is;
- what output the process produces;
- what level of detail is required.
If scope is unclear, the map can become too large to use.
A SIPOC is often helpful before detailed mapping because it defines the high-level Suppliers, Inputs, Process, Outputs, and Customers.
Map the actual process
Do not map the process only from procedures or assumptions.
Go to the work.
Talk with the people who perform it.
Review actual forms, screens, materials, and decisions.
This follows the logic of Gemba: understand the real condition before designing the future one.
The difference between the documented process and the actual process is often an important improvement finding.
Common process-map elements
A basic map may use:
- rectangles for activities;
- diamonds for decisions;
- arrows for flow;
- start and end symbols;
- swimlanes for departments or roles;
- annotations for delays, queues, or systems.
The notation should be simple enough that the team can use it.
The map is a thinking tool, not a drafting competition.
Current state before future state
Teams sometimes jump directly to designing a better process.
That can hide the real causes of the current problem.
First map the current state.
Then ask:
- Which steps create customer value?
- Which steps are required but non-value-adding?
- Which steps are unnecessary?
- Where does work wait?
- Where does information get lost?
- Where does rework occur?
- Where are decisions unclear?
- Where does ownership change?
This connects process mapping to the 8 Wastes of Lean and to Value Stream Mapping when the team needs a broader material-and-information-flow view.
Process map vs Value Stream Map
These methods overlap, but they are not identical.
A process map typically focuses on the sequence of activities and decisions within a process.
A Value Stream Map typically emphasizes end-to-end material and information flow, including lead time, inventory, production control, and flow design.
Use the level of mapping that fits the problem.
Add data where it helps
A process map becomes more useful when selected data is added.
Examples include:
- processing time;
- wait time;
- error frequency;
- rework rate;
- queue size;
- first-pass yield;
- number of handoffs;
- approval time.
Do not overload the map with every available metric.
Use data that helps explain performance.
Common mistakes
Mapping the ideal process instead of the real one
That removes the very problems the team needs to see.
Including too much detail
A map with hundreds of boxes may be technically complete but practically useless.
Mapping without the people who do the work
This usually creates an inaccurate process picture.
Treating every step as necessary
Ask why each activity exists and what customer or business requirement it supports.
Improving one step while hurting the system
Local optimization can move the problem downstream.
A practical mapping sequence
- Define start and end points.
- Identify the customer and output.
- Observe the actual process.
- Capture the major steps in sequence.
- Add decisions, handoffs, and rework loops.
- Validate the map with the people doing the work.
- Add selected performance data.
- Identify waste, delay, variation, and unclear ownership.
- Design the future state.
- Test the new process using PDCA.
The practical lesson
Process mapping helps teams stop debating what they think happens.
It creates a shared view of what actually happens.
Once the work is visible, improvement becomes much more precise.
Related application
This topic also connects with Process Ownership. Use that method when the improvement requires the related management or operating discipline.