
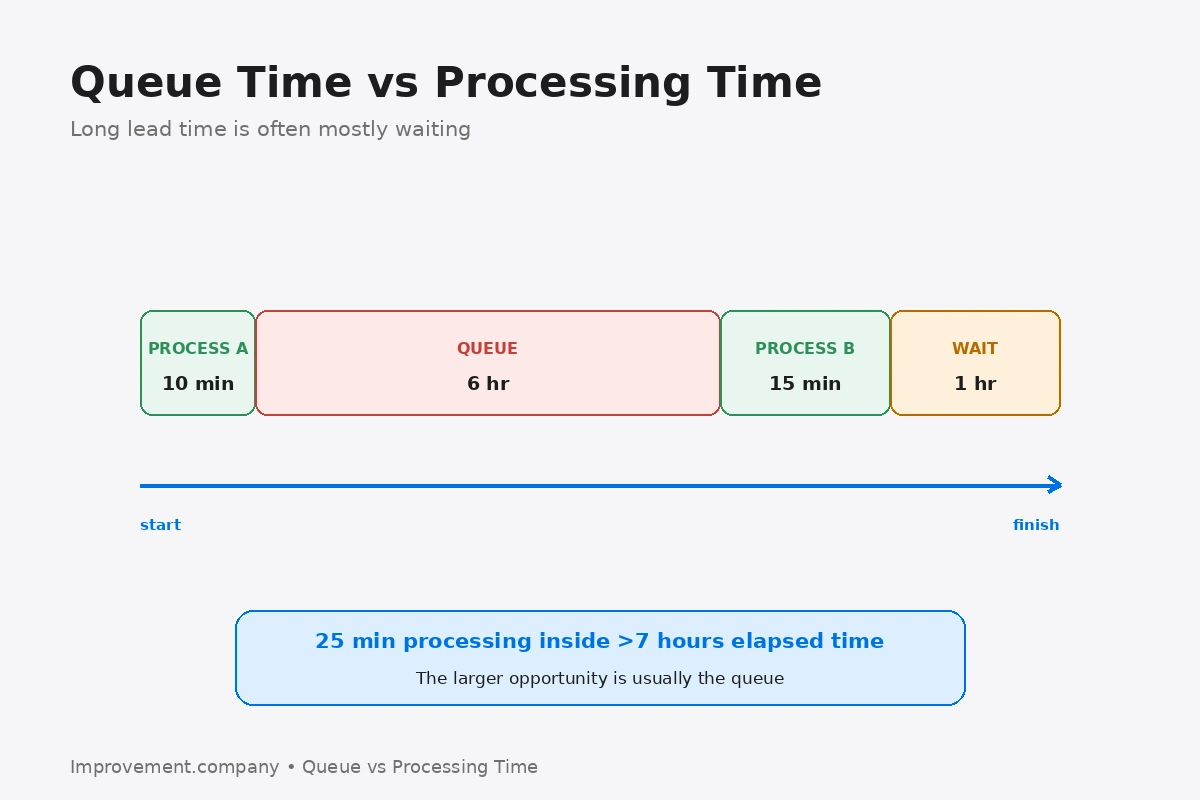
Queue Time is the elapsed time work waits before the next process step begins.
Processing Time is the time the process is actively working on the item.
The difference matters because long lead times are often dominated by waiting rather than work.
Use a simple example
Suppose a job requires:
- 10 minutes processing at Step A;
- 6 hours waiting;
- 15 minutes processing at Step B.
Total elapsed time is more than six hours.
Actual processing time is only 25 minutes.
Lead Time includes both processing and waiting from the defined start to finish.
Measure the two separately
If the organization records only process cycle times, large queues may remain invisible.
Capture:
- timestamp entering queue;
- timestamp work begins;
- timestamp work ends.
This separates queue time from processing time.
Connect queue time with WIP
Work in Process is closely related to waiting.
When too much work is released into a constrained process, jobs accumulate in queues.
Little’s Law connects WIP, throughput, and lead time at the system level.
Reducing WIP can therefore reduce queue time even if the actual processing method does not change.
Find the constraint
Bottleneck Analysis helps identify where limited capacity causes work to accumulate.
A queue in front of the constraint may be intentional to protect throughput.
A queue behind the constraint may signal a different issue.
Not every queue should be removed without understanding its purpose.
Examine batching
Large transfer batches can create waiting even when each step is capable.
For example, Step B may wait until 100 units are complete at Step A.
Reducing transfer quantity can sometimes reduce queue time dramatically.
One-Piece Flow provides the principle of moving work in smaller quantities where the process supports it.
Compare improvement opportunities
A team may spend weeks reducing a 10-minute operation to 8 minutes while the job still waits six hours.
The larger opportunity may be:
- release logic;
- queue control;
- smaller batch;
- better sequencing.
The best improvement target is the one affecting total flow.
Use flow efficiency
Flow Efficiency compares active work with total elapsed time.
A very low flow-efficiency result often signals that waiting dominates the value stream.
Common mistakes
Calling processing time lead time, optimizing fast tasks while queues remain huge, releasing more work to keep every resource busy, removing protective buffers without understanding the constraint, ignoring batch transfer delay, and measuring averages that hide extreme queue times are common mistakes.
Practical sequence
- define the process boundaries.
- timestamp queue entry.
- timestamp processing start and finish.
- calculate queue and processing time.
- identify the largest queues.
- understand the constraint.
- examine release and batch rules.
- reduce unnecessary WIP.
- remeasure lead time.
- verify that throughput remains protected.
The practical lesson
Queue Time explains why a process can contain fast operations and still deliver slowly.
Before making the work faster, measure how long the work is waiting.