
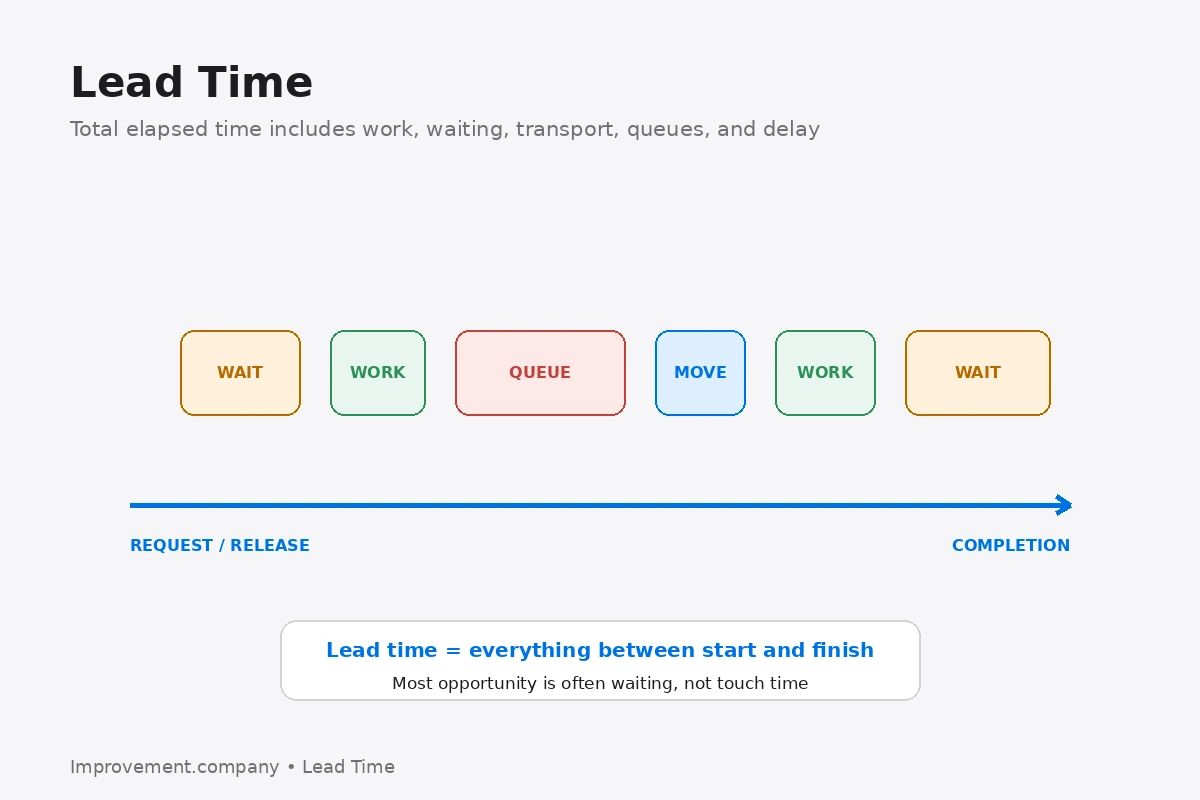
Lead Time is the total elapsed time from a defined starting point to a defined completion point.
Depending on the process, the start may be a customer order, production release, material request, or service request. The finish may be shipment, completed operation, delivered service, or approved response.
The important point is that lead time includes much more than processing time.
Separate elapsed time from touch time
A job may require only 30 minutes of actual work but remain in the system for five days.
The difference can come from:
- waiting;
- queues;
- transport;
- batching;
- approvals;
- rework.
Flow Efficiency compares active or value-creating work time with total elapsed time. That makes lead time one of the most useful measures for exposing hidden waiting.
Define the boundaries clearly
A lead-time measure is only useful when the start and finish are consistent.
Operational Definition helps define the trigger, timestamp, inclusion rule, and exclusion rule.
For example, order lead time could mean order receipt to shipment, while production lead time could mean production release to finished goods. Do not mix those definitions.
Connect lead time with WIP and throughput
Little’s Law connects three system-level measures:
WIP = Throughput × Lead Time
If throughput remains similar, excessive WIP usually increases lead time. This is why releasing more work into an already congested process often makes delivery performance worse rather than better.
Map where time is consumed
Value Stream Mapping can show processing time, waiting time, inventory, and information delays.
The largest lead-time opportunity is often outside the actual work step. A five-minute operation can sit in a two-day queue.
Consider product mix and priority
Different products or service types may have very different lead times.
Stratify by product family, route, priority, customer, or work type. An overall average can hide a slow high-priority segment.
Use the distribution, not only the average
A single average may be misleading when lead time is highly variable.
Useful views may include median, percentile, range, and trend. A process averaging three days with a 95th percentile of twelve days may create serious customer risk even if the average looks reasonable.
Reduce lead time systematically
Common levers include reducing WIP, removing queues, improving flow, reducing changeover, improving first-pass yield, and clarifying priorities.
One-Piece Flow can reduce waiting between steps when the process can support smaller transfer quantities.
Bottleneck Analysis helps identify where limited capacity constrains overall flow.
Common mistakes
Measuring only processing time, changing the start point between reports, averaging very different product families together, releasing more work to improve utilization, ignoring queue time, and celebrating faster local cycle time while customer lead time stays unchanged are common mistakes.
Practical sequence
- define the start point.
- define the finish point.
- capture elapsed time consistently.
- separate processing from waiting.
- stratify by important work types.
- connect lead time with WIP and throughput.
- identify major queues.
- improve flow constraints.
- reduce unnecessary WIP.
- monitor average and variation.
The practical lesson
Lead Time measures how long the customer or job waits for the entire system.
Reducing lead time usually requires improving flow, not simply making one task faster.
Related application
This topic also connects with Queue Time vs Processing Time. Use that method when the improvement requires the related operating or management discipline.