
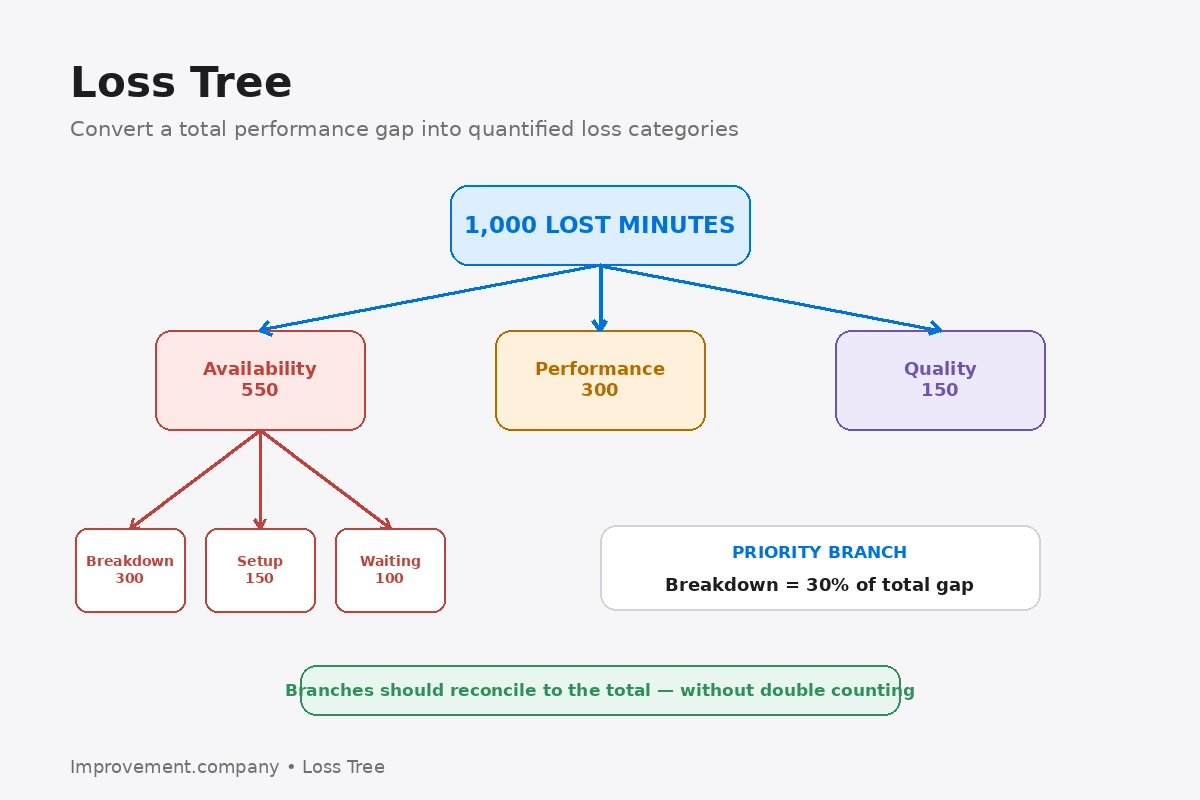
A Loss Tree is a structured breakdown of a high-level performance gap into increasingly specific loss categories.
It helps teams answer:
Where is the performance actually being lost?
The tree converts a broad target gap into quantified branches that can be prioritized for improvement.
Start with a defined total gap
Examples include:
- available hours not converted into output;
- theoretical output minus actual output;
- planned margin minus actual margin;
- total scheduled time minus productive time.
The top of the tree should have a clear calculation.
Operational Definition helps keep the measurement rules stable.
Build major loss branches
A manufacturing loss tree may include:
- availability loss;
- performance loss;
- quality loss.
OEE uses a similar structure through Availability, Performance, and Quality.
However, a loss tree can be adapted to other systems and does not have to be limited to OEE.
Decompose each branch further
Availability loss might separate into:
- breakdown;
- setup;
- waiting;
- planned stop.
Quality loss might separate into:
- scrap;
- rework;
- startup loss.
Production Loss Analysis can provide the event-level data used to quantify these branches.
Make branches additive
Where practical, the branches should reconcile to the parent total.
If the top-level gap is 1,000 lost minutes, the major branches should explain those 1,000 minutes without double-counting.
This makes the tree more than a brainstorming diagram.
Prioritize value, not only frequency
The largest branch often deserves attention, but the team should also consider:
- cost;
- customer impact;
- constraint impact;
- safety;
- recurrence.
Pareto Analysis can help rank the dominant categories within a branch.
Connect the tree to improvement work
A loss tree should lead to action.
For example:
performance gap
→ downtime
→ unplanned downtime
→ Line 3
→ conveyor failures
That branch can become a focused improvement problem.
Problem Decomposition uses the same logic of narrowing a broad problem into measurable subproblems.
Update the tree as conditions change
The dominant loss today may not be dominant after improvement.
Review the tree periodically so the improvement portfolio continues to target the current biggest gaps.
Avoid false precision
Loss data may come from:
- manual coding;
- downtime systems;
- estimates.
The team should understand data quality before treating small differences as meaningful.
Common mistakes
Using overlapping loss categories, double-counting time, building a tree without reconciling to the total gap, focusing only on event frequency, selecting improvement projects without quantifying impact, and keeping the same priorities after major losses have changed are common mistakes.
Practical sequence
- define the total performance gap.
- define major loss categories.
- quantify each category.
- reconcile branches to the parent total.
- decompose major branches.
- identify the dominant or highest-risk losses.
- convert important branches into focused problems.
- assign improvement work.
- verify benefit.
- refresh the loss tree as performance changes.
The practical lesson
A Loss Tree makes the performance gap visible as a set of quantified losses.
It helps the organization choose improvement work based on where value is actually being lost.