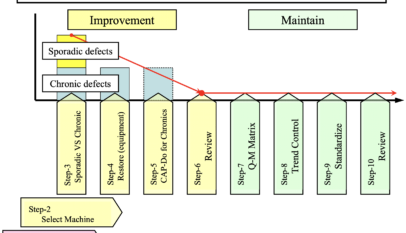
Lean Manufacturing Problem Solving Process Excellence

The Pareto Rule and Analysis: Understanding the 80/20 Principle

The Pareto rule, also known as the 80/20 principle, is useful for analyzing and improving a wide range of systems, processes, and products. This principle states that 80% of the effects come from 20% of the causes. This concept can be applied in various areas, including business, finance, and personal life. In business, the Pareto rule is often used to identify the key drivers of revenue, costs, and customer complaints. Organizations can prioritize their efforts…

Continue reading

Lean Manufacturing Process Excellence

How to prioritize breakdowns for root cause analysis

Choose breakdowns for investigation: Following these steps, you can effectively choose breakdowns for investigation and prioritize your root cause analysis efforts to achieve the greatest impact. It’s important to note that these are just general guidelines, and the specific priorities will depend on your organization’s unique needs and circumstances. Root cause analysis is a systematic process that requires careful investigation and analysis to identify the underlying causes of breakdowns.

Continue reading

Process Excellence

Control Charts: A Vital Tool for Quality Control in Manufacturing

Control charts, also known as process behavior charts, are a powerful tool for monitoring and controlling the quality of a process in manufacturing and other industries. With the ability to visually represent a process’s stability and detect changes or patterns that fall outside of the normal operating range, control charts provide valuable insights into the root cause of problems. By analyzing the data, organizations can make data-driven decisions to improve the process, reducing the risk of defects and improving overall quality. In short, control charts are a must-have tool for any organization looking to improve the quality of their products and processes.

Continue reading

Process Excellence

Sigma level and DPMO

The true defective ppm (not DPMO) for the six sigma level is 0.002, not 3.4 DPMO. In Six Sigma, it is a common practice to consider that 3.4 DPMO corresponds to a six sigma level, which is a misconception because it assumes a 1.5 sigma shift, which in turn, a mature manufacturing industry process would never accept. In other words, the 3.4 DPMO corresponds to a 4.5 sigma level considering only one side of the specification.The…

Continue reading

Quality

The 7 QC Tools – Understanding Histograms for Improved Quality Control

Quality control is a critical aspect of any manufacturing process, and having the right tools in place to monitor and control it is essential. One of the 7 QC tools, the histogram, provides a valuable tool for improving quality control. Histograms provide a visual representation of the frequency of data points in a process, making it easier to identify patterns and trends. By detecting changes that fall outside of the desired range, histograms help organizations to identify and resolve issues quickly. Additionally, histograms allow for statistical analysis of the process data, enabling organizations to make data-driven decisions and improve their processes. By incorporating histograms into their quality control processes, organizations can ensure that their processes and products meet their desired quality standards.

Continue reading

Project Management

Google Project Management: An Overview

Google Project Management provides organizations with a comprehensive set of tools for planning, executing, and monitoring projects in real-time. With its cloud-based solution and integration with other Google tools, teams can collaborate effectively and efficiently to ensure that projects are delivered on time and within budget. The platform features a Gantt chart for visual representation of the project timeline and progress, as well as robust reporting and analytics capabilities. Additionally, collaboration features such as real-time communication and file sharing allow for smooth and seamless project management, making it a valuable tool for both small businesses and large enterprises.

Continue reading

Process Excellence

SMED – Streamlining Your Production Process

Introduction: Companies are constantly looking for ways to increase efficiency and reduce downtime in today’s fast-paced business world. SMED, or Single-Minute Exchange of Dies, is a methodology for reducing the time it takes to change from producing one product to another. This technique has been proven to improve production efficiency and increase overall profitability for manufacturers. What is SMED? SMED is a technique for reducing the time it takes to change from producing one product…

Continue reading

Process Excellence

Planned Maintenance Indicators: A Guide to Improved Equipment Reliability

Effective maintenance is critical to the success of any manufacturing operation. It helps to keep equipment running smoothly, reduces downtime, and improves overall productivity. One of the key components of effective maintenance is planned maintenance, which involves scheduling regular maintenance activities in advance to prevent equipment failures and minimize downtime. In this blog post, we will explore the importance of planned maintenance indicators and how they can help to improve equipment reliability. What are Planned…

Continue reading