
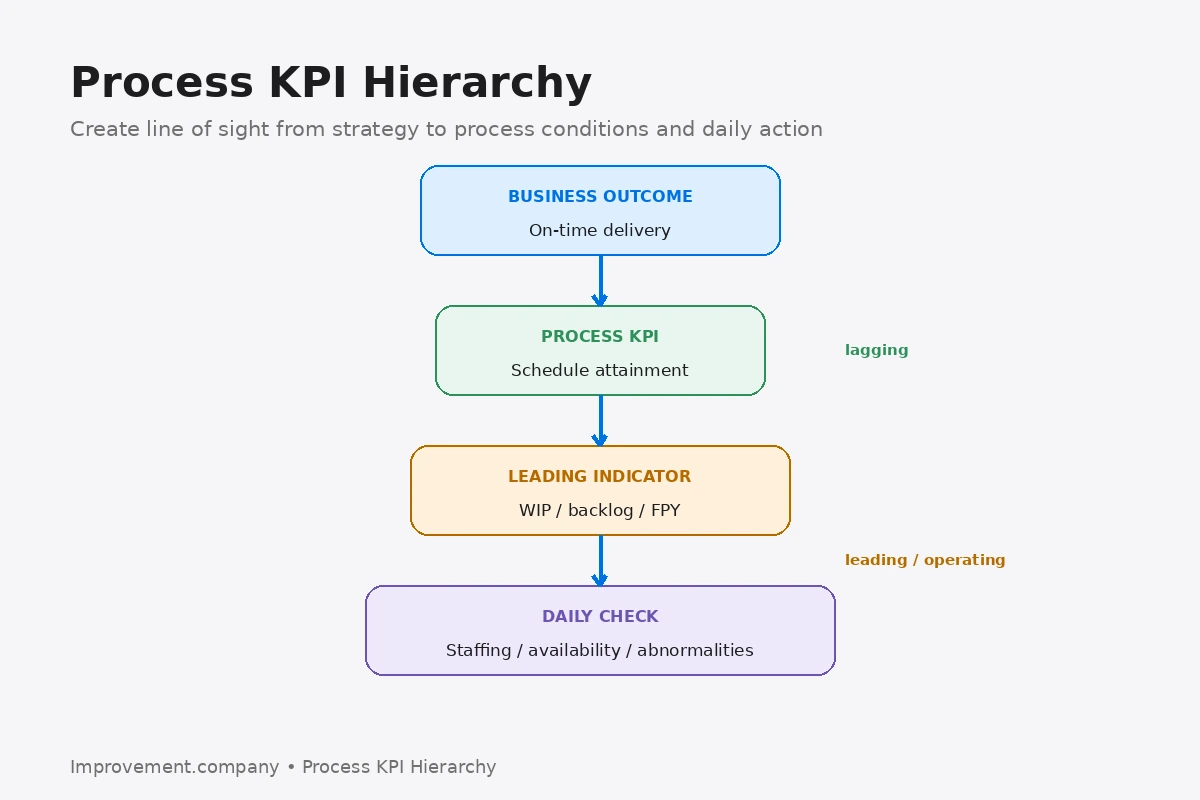
A Process KPI Hierarchy connects high-level business outcomes with the process measures that influence them.
The objective is to avoid two common extremes:
- only measuring final results;
- measuring dozens of activities with no connection to outcomes.
A good hierarchy shows how daily work contributes to process and business performance.
Start with the outcome
Examples include:
- customer delivery;
- quality;
- cost;
- cash;
- safety.
Process Performance Management provides the broader discipline for selecting, reviewing, and acting on process measures.
The hierarchy should support decisions, not simply reporting.
Define the process result
Ask:
What result must this process produce to contribute to the higher-level outcome?
For example:
- business outcome: on-time delivery;
- process result: production schedule attainment.
Schedule Attainment may be a direct process result supporting customer delivery.
Identify leading drivers
Leading measures may indicate conditions that influence the result before the final outcome is missed.
Examples include:
- backlog;
- WIP;
- staffing;
- equipment availability;
- first-pass yield.
The relationship should be plausible and preferably supported by data.
Keep levels distinct
A practical hierarchy may contain:
- outcome KPI;
- process KPI;
- leading indicator;
- operating check.
Do not label every measure a KPI.
Some measures are useful control indicators without being key performance indicators.
Assign ownership
Each measure should have an owner who understands:
- definition;
- data source;
- target;
- reaction.
Process Ownership helps connect accountability with end-to-end process performance.
Define reaction logic
A KPI hierarchy becomes useful when abnormal performance triggers action.
Management by Exception helps leaders focus attention where results or conditions deviate from expected ranges.
A red metric without a reaction rule is only decoration.
Avoid conflicting measures
Local measures can encourage behavior that damages the larger system.
Examples include:
- maximizing machine utilization while WIP grows;
- minimizing maintenance hours while breakdown risk increases.
Theory of Constraints reinforces the importance of system performance over local optimization.
Review the hierarchy periodically
Measures should change when:
- strategy changes;
- process design changes;
- a driver is no longer predictive;
- the process matures.
Do not preserve a KPI simply because it has always been reported.
Common mistakes
Creating too many KPIs, measuring activity instead of outcomes, using lagging measures only, assigning no owner, allowing definitions to differ across reports, rewarding local optimization, and maintaining metrics that no longer influence decisions are common mistakes.
Practical sequence
- define the business outcome.
- identify the contributing process result.
- identify leading drivers.
- define each measure operationally.
- assign ownership.
- define target and reaction.
- check for conflicting incentives.
- display measures at the right management level.
- review causal relationships.
- remove metrics that no longer support decisions.
The practical lesson
A Process KPI Hierarchy creates a line of sight from daily conditions to strategic outcomes.
Good measures explain what is happening, why it matters, and where action should occur.